/home/runner/work/strom/strom/.venv/lib/python3.10/site-packages/sklearn/svm/_base.py:1250: ConvergenceWarning:
Liblinear failed to converge, increase the number of iterations.
Model Cards provide a framework for transparent, responsible reporting.
Use the vetiver `.qmd` Quarto template as a place to start,
with vetiver.model_card()
Writing pin:
Name: 'wd-svm'
Version: 20260412T133848Z-673f7SVM
Before moving forward with the to-do list, let’s throw a Random Forest to it.
SVM
For many reasons, Random Forest is usually a very good baseline model. In this particular case I started with the polynomial OLS as baseline model, just because it was so evident from the correlations that the relationship between temperature and consumption follows a polynomial shape. But let’s go back to a beloved RF.
⏩ stepit 'svm_raw': Starting execution of `strom.modelling.assess_model()` 2026-04-12 13:38:48 /home/runner/work/strom/strom/.venv/lib/python3.10/site-packages/sklearn/svm/_base.py:1250: ConvergenceWarning: Liblinear failed to converge, increase the number of iterations. ⏩ stepit 'get_single_split_metrics': Starting execution of `strom.modelling.get_single_split_metrics()` 2026-04-12 13:38:49 ✅ stepit 'get_single_split_metrics': Successfully completed and cached [exec time 0.0 seconds, cache time 0.0 seconds, size 1.0 KB] `strom.modelling.get_single_split_metrics()` 2026-04-12 13:38:49 ⏩ stepit 'cross_validate_pipe': Starting execution of `strom.modelling.cross_validate_pipe()` 2026-04-12 13:38:49 [Parallel(n_jobs=-1)]: Using backend LokyBackend with 4 concurrent workers. /home/runner/work/strom/strom/.venv/lib/python3.10/site-packages/sklearn/svm/_base.py:1250: ConvergenceWarning: Liblinear failed to converge, increase the number of iterations. warnings.warn( /home/runner/work/strom/strom/.venv/lib/python3.10/site-packages/sklearn/svm/_base.py:1250: ConvergenceWarning: Liblinear failed to converge, increase the number of iterations. warnings.warn( /home/runner/work/strom/strom/.venv/lib/python3.10/site-packages/sklearn/svm/_base.py:1250: ConvergenceWarning: Liblinear failed to converge, increase the number of iterations. warnings.warn( /home/runner/work/strom/strom/.venv/lib/python3.10/site-packages/sklearn/svm/_base.py:1250: ConvergenceWarning: Liblinear failed to converge, increase the number of iterations. warnings.warn( /home/runner/work/strom/strom/.venv/lib/python3.10/site-packages/sklearn/svm/_base.py:1250: ConvergenceWarning: Liblinear failed to converge, increase the number of iterations. warnings.warn( [Parallel(n_jobs=-1)]: Done 5 out of 5 | elapsed: 2.1s finished ✅ stepit 'cross_validate_pipe': Successfully completed and cached [exec time 2.1 seconds, cache time 0.0 seconds, size 2.2 KB] `strom.modelling.cross_validate_pipe()` 2026-04-12 13:38:51 ✅ stepit 'svm_raw': Successfully completed and cached [exec time 2.2 seconds, cache time 0.0 seconds, size 15.9 KB] `strom.modelling.assess_model()` 2026-04-12 13:38:51
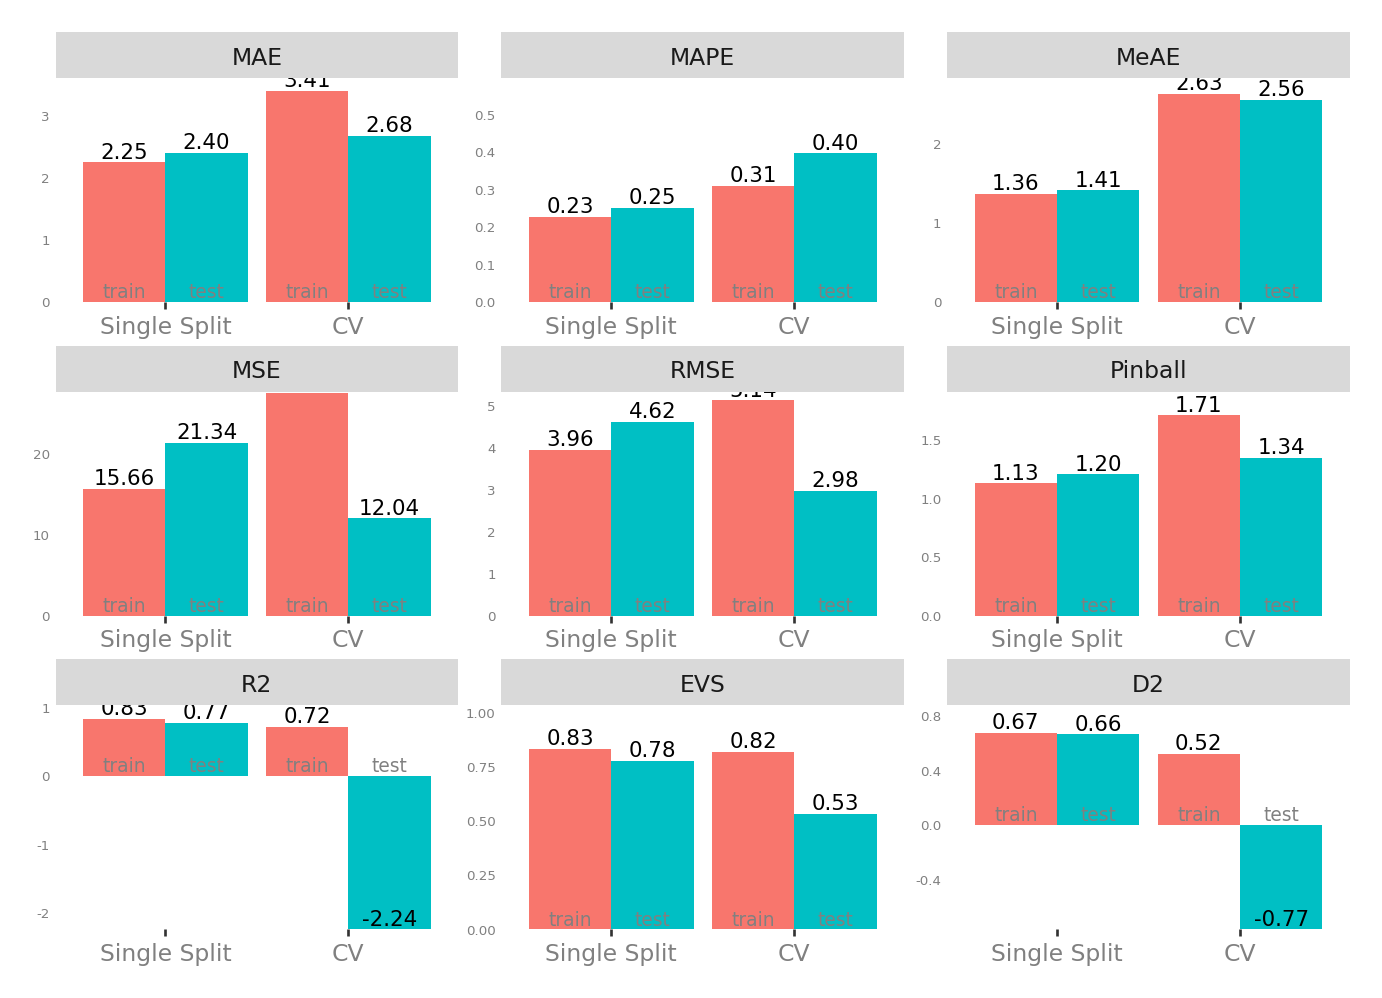
Metrics
| Single Split | CV | |||
|---|---|---|---|---|
| train | test | test | train | |
| MAE - Mean Absolute Error | 2.475187 | 2.610312 | 1.580149 | 2.846781 |
| MSE - Mean Squared Error | 17.090802 | 21.174536 | 4.548692 | 21.585205 |
| RMSE - Root Mean Squared Error | 4.134102 | 4.601580 | 1.957716 | 4.637447 |
| R2 - Coefficient of Determination | 0.816620 | 0.783660 | 0.069484 | 0.781292 |
| MAPE - Mean Absolute Percentage Error | 0.236614 | 0.205644 | 0.217716 | 0.242006 |
| EVS - Explained Variance Score | 0.839227 | 0.815276 | 0.470734 | 0.814698 |
| MeAE - Median Absolute Error | 1.695916 | 1.663678 | 1.432526 | 2.003091 |
| D2 - D2 Absolute Error Score | 0.642667 | 0.659754 | 0.061373 | 0.599167 |
| Pinball - Mean Pinball Loss | 1.237594 | 1.305156 | 0.790075 | 1.423390 |
Scatter plot matrix
Observed vs. Predicted and Residuals vs. Predicted
Check for …
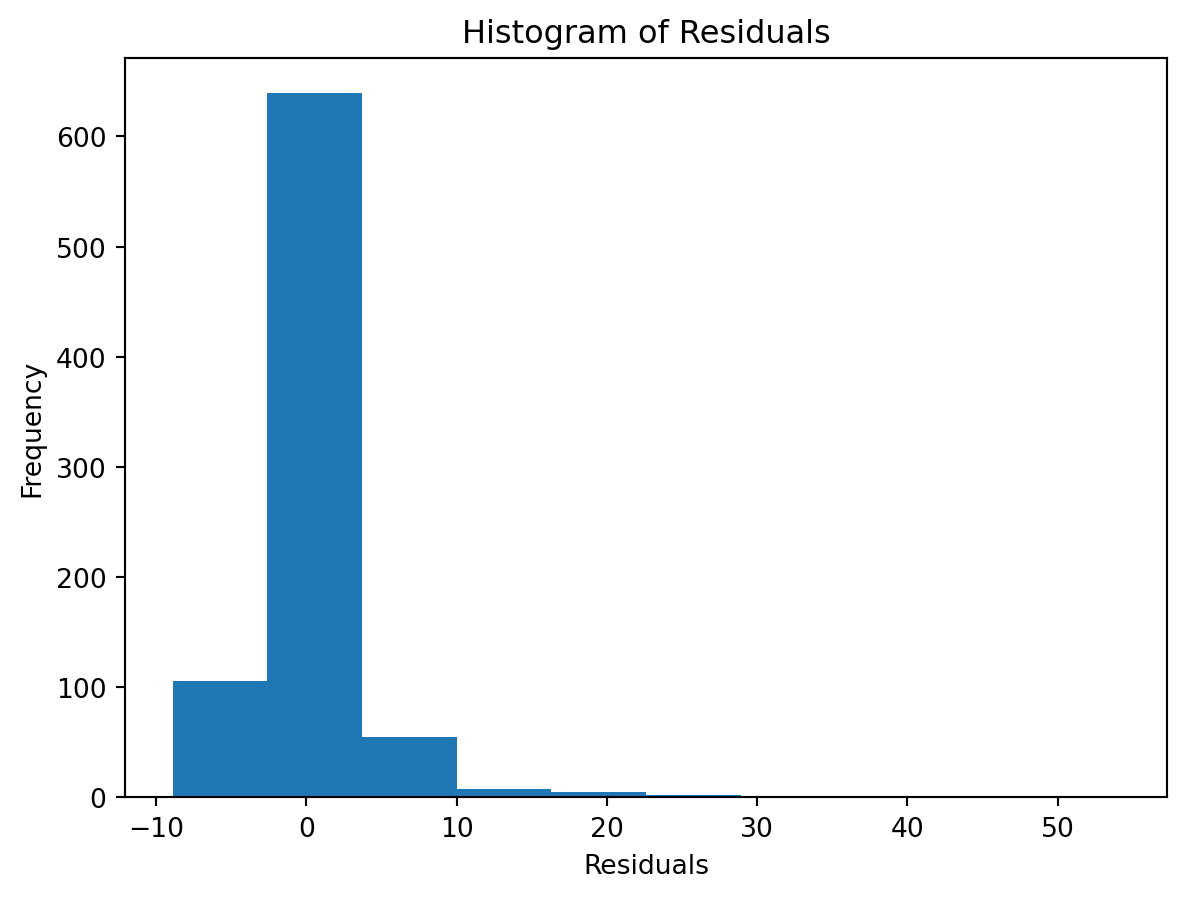
check the residuals to assess the goodness of fit.
- white noise or is there a pattern?
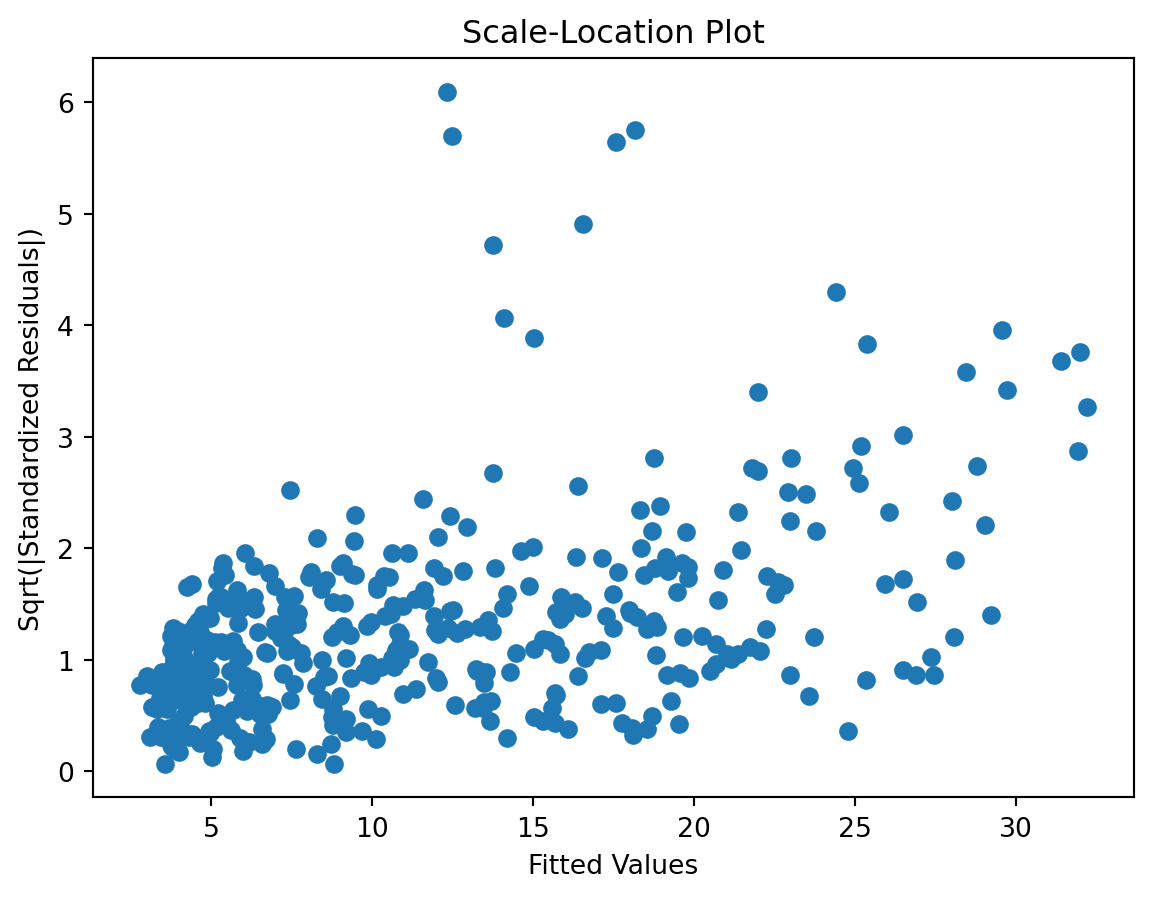
- heteroscedasticity?
- non-linearity?
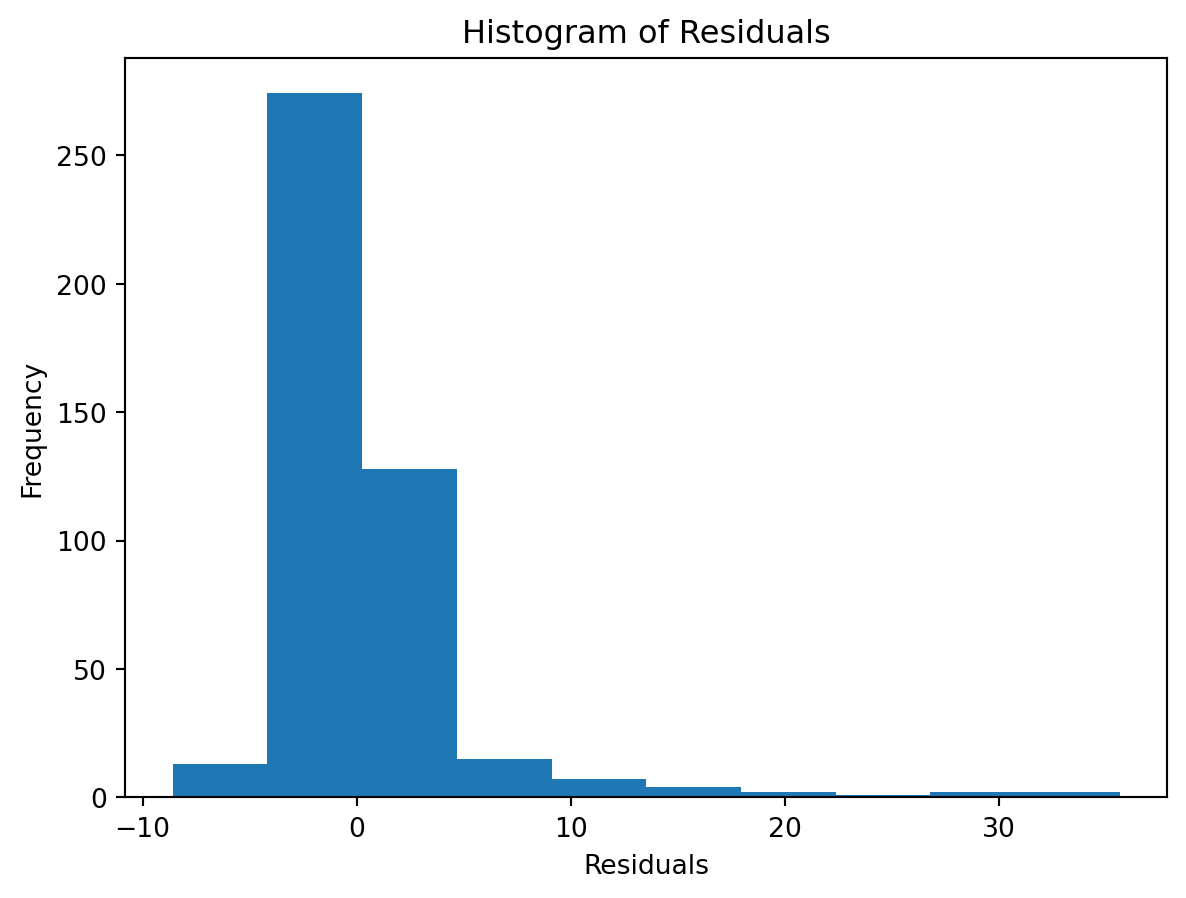
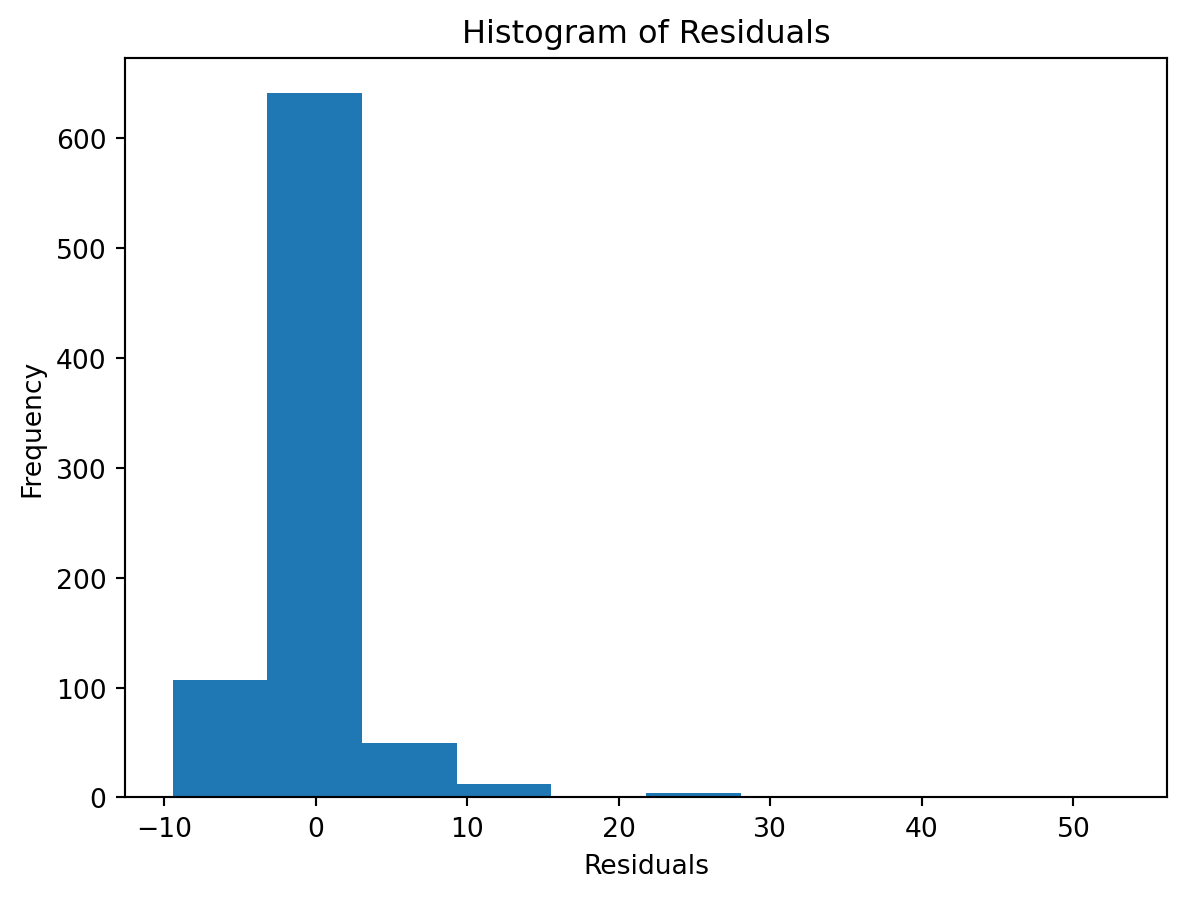
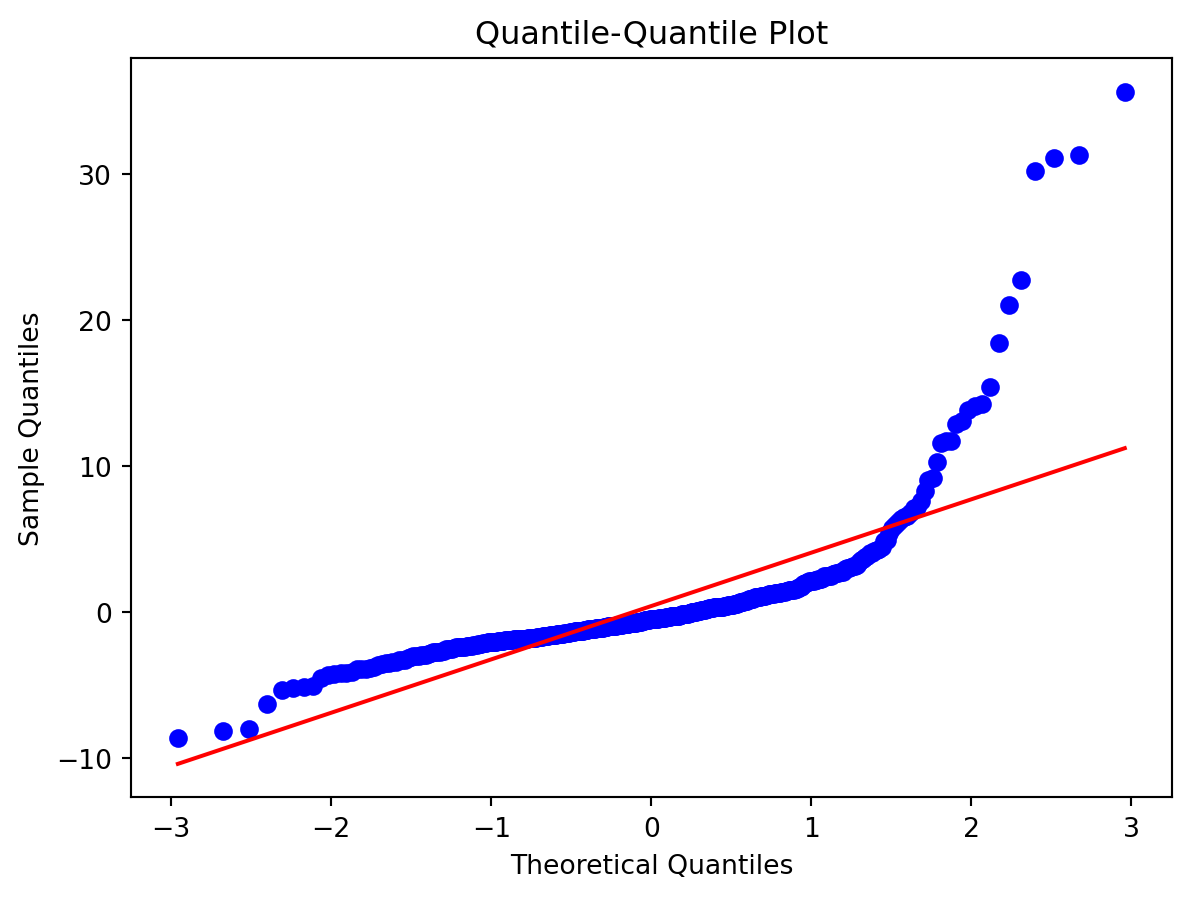
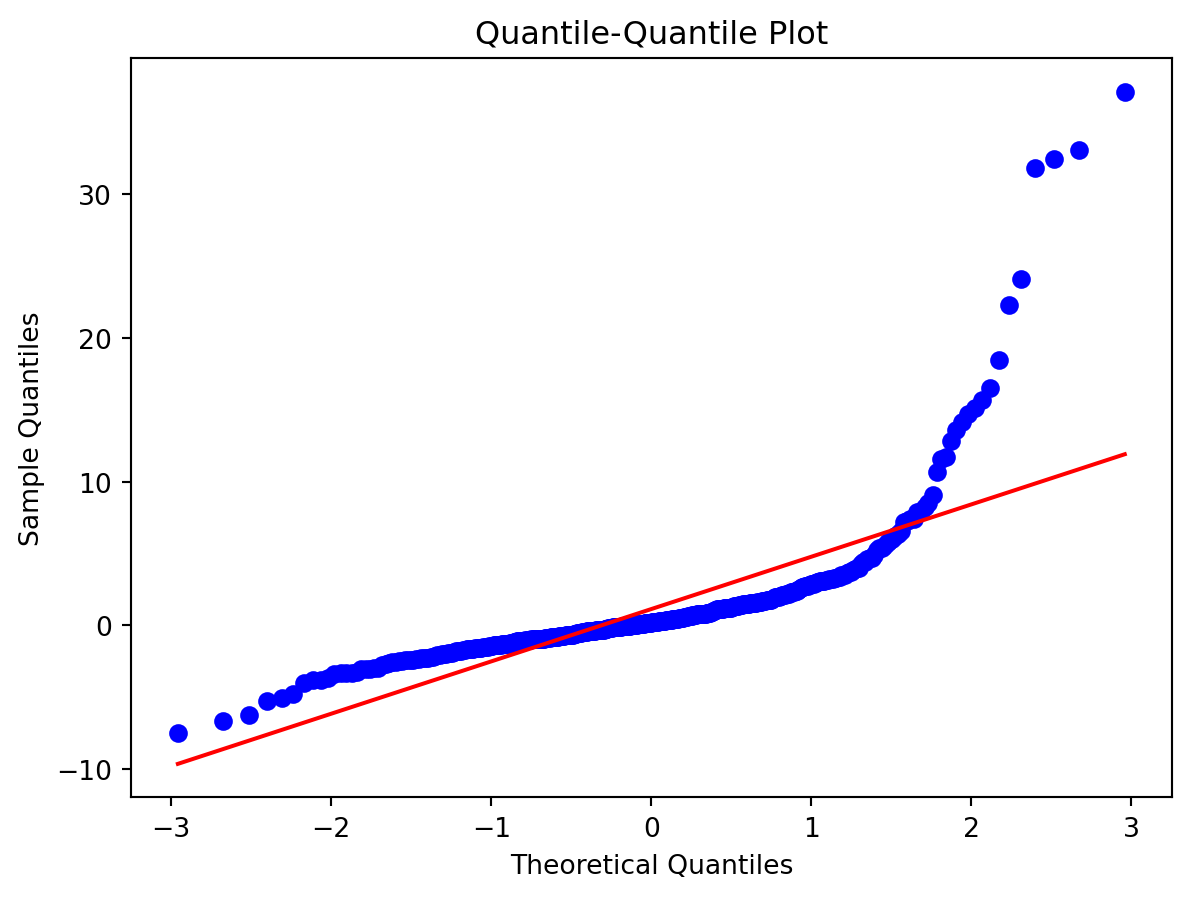
Normality of Residuals:
Check for …
- Are residuals normally distributed?
Leverage
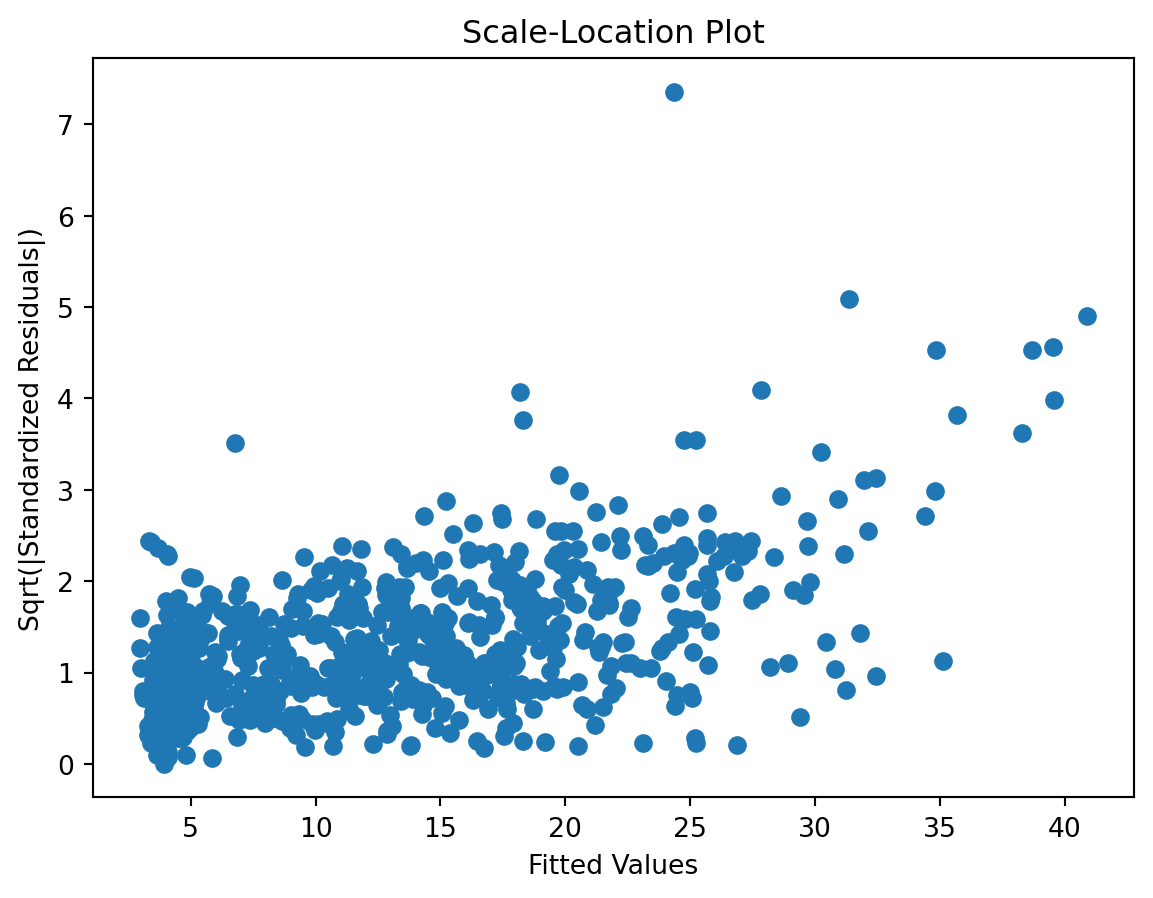
Scale-Location plot

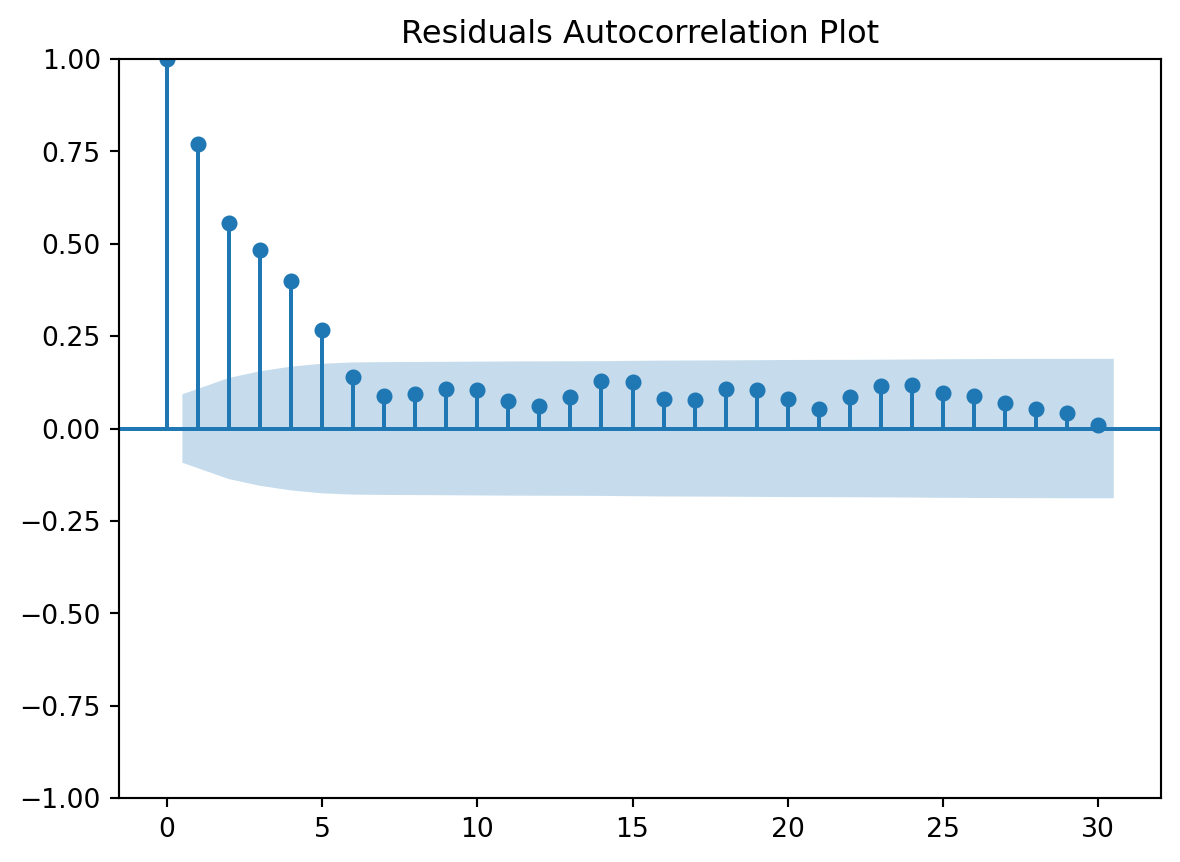
Residuals Autocorrelation Plot
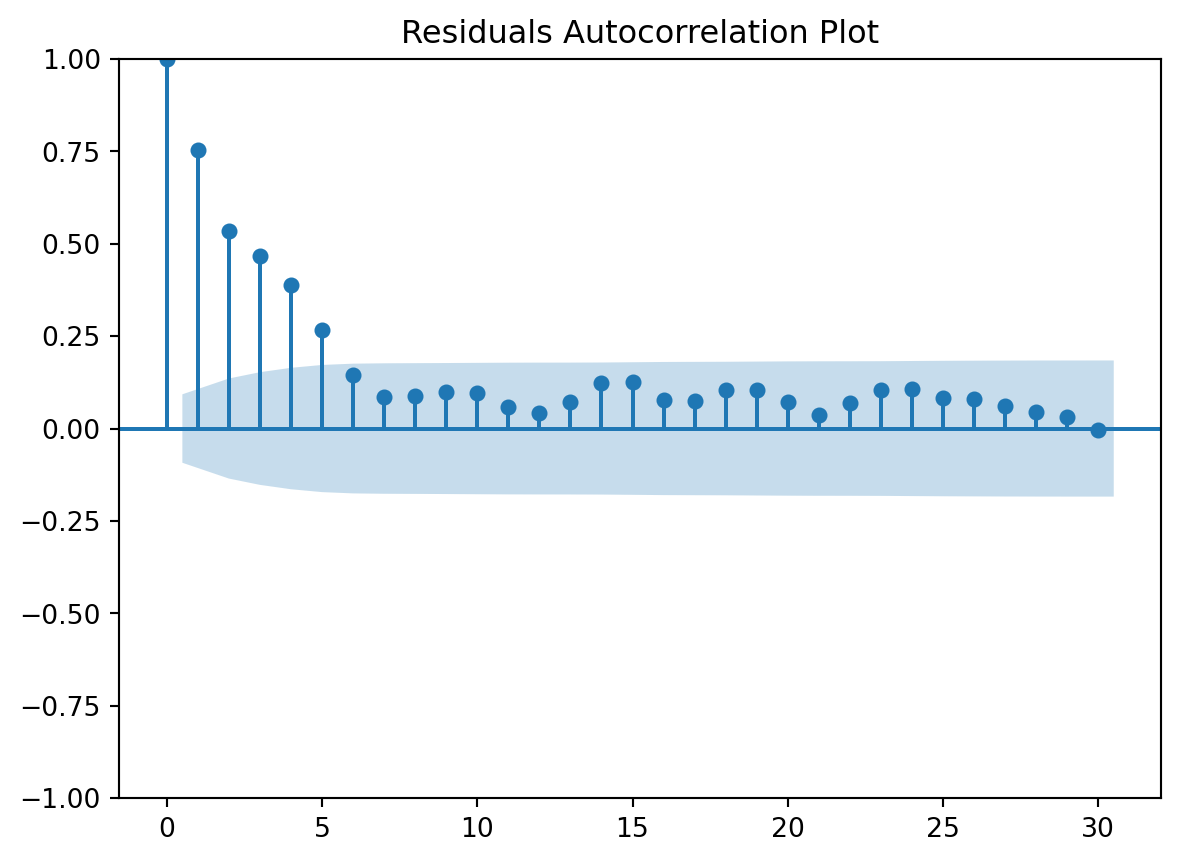
Residuals vs Time
Well, not that bad, but it is overfitting quite a lot.
⏩ stepit 'grid_search_pipe': Starting execution of `strom.modelling.grid_search_pipe()` 2026-04-12 13:38:55 /home/runner/work/strom/strom/.venv/lib/python3.10/site-packages/sklearn/svm/_base.py:1250: ConvergenceWarning: Liblinear failed to converge, increase the number of iterations. warnings.warn( /home/runner/work/strom/strom/.venv/lib/python3.10/site-packages/sklearn/svm/_base.py:1250: ConvergenceWarning: Liblinear failed to converge, increase the number of iterations. warnings.warn( /home/runner/work/strom/strom/.venv/lib/python3.10/site-packages/sklearn/svm/_base.py:1250: ConvergenceWarning: Liblinear failed to converge, increase the number of iterations. warnings.warn( /home/runner/work/strom/strom/.venv/lib/python3.10/site-packages/sklearn/svm/_base.py:1250: ConvergenceWarning: Liblinear failed to converge, increase the number of iterations. warnings.warn( /home/runner/work/strom/strom/.venv/lib/python3.10/site-packages/sklearn/svm/_base.py:1250: ConvergenceWarning: Liblinear failed to converge, increase the number of iterations. warnings.warn( /home/runner/work/strom/strom/.venv/lib/python3.10/site-packages/sklearn/svm/_base.py:1250: ConvergenceWarning: Liblinear failed to converge, increase the number of iterations. warnings.warn( /home/runner/work/strom/strom/.venv/lib/python3.10/site-packages/sklearn/svm/_base.py:1250: ConvergenceWarning: Liblinear failed to converge, increase the number of iterations. warnings.warn( /home/runner/work/strom/strom/.venv/lib/python3.10/site-packages/sklearn/svm/_base.py:1250: ConvergenceWarning: Liblinear failed to converge, increase the number of iterations. warnings.warn( /home/runner/work/strom/strom/.venv/lib/python3.10/site-packages/sklearn/svm/_base.py:1250: ConvergenceWarning: Liblinear failed to converge, increase the number of iterations. warnings.warn( /home/runner/work/strom/strom/.venv/lib/python3.10/site-packages/sklearn/svm/_base.py:1250: ConvergenceWarning: Liblinear failed to converge, increase the number of iterations. warnings.warn( /home/runner/work/strom/strom/.venv/lib/python3.10/site-packages/sklearn/svm/_base.py:1250: ConvergenceWarning: Liblinear failed to converge, increase the number of iterations. warnings.warn( /home/runner/work/strom/strom/.venv/lib/python3.10/site-packages/sklearn/svm/_base.py:1250: ConvergenceWarning: Liblinear failed to converge, increase the number of iterations. warnings.warn( /home/runner/work/strom/strom/.venv/lib/python3.10/site-packages/sklearn/svm/_base.py:1250: ConvergenceWarning: Liblinear failed to converge, increase the number of iterations. warnings.warn( /home/runner/work/strom/strom/.venv/lib/python3.10/site-packages/sklearn/svm/_base.py:1250: ConvergenceWarning: Liblinear failed to converge, increase the number of iterations. warnings.warn( /home/runner/work/strom/strom/.venv/lib/python3.10/site-packages/sklearn/svm/_base.py:1250: ConvergenceWarning: Liblinear failed to converge, increase the number of iterations. warnings.warn( /home/runner/work/strom/strom/.venv/lib/python3.10/site-packages/sklearn/svm/_base.py:1250: ConvergenceWarning: Liblinear failed to converge, increase the number of iterations. warnings.warn( /home/runner/work/strom/strom/.venv/lib/python3.10/site-packages/sklearn/svm/_base.py:1250: ConvergenceWarning: Liblinear failed to converge, increase the number of iterations. warnings.warn( /home/runner/work/strom/strom/.venv/lib/python3.10/site-packages/sklearn/svm/_base.py:1250: ConvergenceWarning: Liblinear failed to converge, increase the number of iterations. warnings.warn( /home/runner/work/strom/strom/.venv/lib/python3.10/site-packages/sklearn/svm/_base.py:1250: ConvergenceWarning: Liblinear failed to converge, increase the number of iterations. warnings.warn( /home/runner/work/strom/strom/.venv/lib/python3.10/site-packages/sklearn/svm/_base.py:1250: ConvergenceWarning: Liblinear failed to converge, increase the number of iterations. warnings.warn( /home/runner/work/strom/strom/.venv/lib/python3.10/site-packages/sklearn/svm/_base.py:1250: ConvergenceWarning: Liblinear failed to converge, increase the number of iterations. warnings.warn( /home/runner/work/strom/strom/.venv/lib/python3.10/site-packages/sklearn/svm/_base.py:1250: ConvergenceWarning: Liblinear failed to converge, increase the number of iterations. warnings.warn( /home/runner/work/strom/strom/.venv/lib/python3.10/site-packages/sklearn/svm/_base.py:1250: ConvergenceWarning: Liblinear failed to converge, increase the number of iterations. warnings.warn( /home/runner/work/strom/strom/.venv/lib/python3.10/site-packages/sklearn/svm/_base.py:1250: ConvergenceWarning: Liblinear failed to converge, increase the number of iterations. warnings.warn( /home/runner/work/strom/strom/.venv/lib/python3.10/site-packages/sklearn/svm/_base.py:1250: ConvergenceWarning: Liblinear failed to converge, increase the number of iterations. warnings.warn( /home/runner/work/strom/strom/.venv/lib/python3.10/site-packages/sklearn/svm/_base.py:1250: ConvergenceWarning: Liblinear failed to converge, increase the number of iterations. warnings.warn( /home/runner/work/strom/strom/.venv/lib/python3.10/site-packages/sklearn/svm/_base.py:1250: ConvergenceWarning: Liblinear failed to converge, increase the number of iterations. warnings.warn( /home/runner/work/strom/strom/.venv/lib/python3.10/site-packages/sklearn/svm/_base.py:1250: ConvergenceWarning: Liblinear failed to converge, increase the number of iterations. warnings.warn( /home/runner/work/strom/strom/.venv/lib/python3.10/site-packages/sklearn/svm/_base.py:1250: ConvergenceWarning: Liblinear failed to converge, increase the number of iterations. warnings.warn( /home/runner/work/strom/strom/.venv/lib/python3.10/site-packages/sklearn/svm/_base.py:1250: ConvergenceWarning: Liblinear failed to converge, increase the number of iterations. warnings.warn( /home/runner/work/strom/strom/.venv/lib/python3.10/site-packages/sklearn/svm/_base.py:1250: ConvergenceWarning: Liblinear failed to converge, increase the number of iterations. warnings.warn( /home/runner/work/strom/strom/.venv/lib/python3.10/site-packages/sklearn/svm/_base.py:1250: ConvergenceWarning: Liblinear failed to converge, increase the number of iterations. warnings.warn( /home/runner/work/strom/strom/.venv/lib/python3.10/site-packages/sklearn/svm/_base.py:1250: ConvergenceWarning: Liblinear failed to converge, increase the number of iterations. warnings.warn( /home/runner/work/strom/strom/.venv/lib/python3.10/site-packages/sklearn/svm/_base.py:1250: ConvergenceWarning: Liblinear failed to converge, increase the number of iterations. warnings.warn( /home/runner/work/strom/strom/.venv/lib/python3.10/site-packages/sklearn/svm/_base.py:1250: ConvergenceWarning: Liblinear failed to converge, increase the number of iterations. warnings.warn( /home/runner/work/strom/strom/.venv/lib/python3.10/site-packages/sklearn/svm/_base.py:1250: ConvergenceWarning: Liblinear failed to converge, increase the number of iterations. warnings.warn( /home/runner/work/strom/strom/.venv/lib/python3.10/site-packages/sklearn/svm/_base.py:1250: ConvergenceWarning: Liblinear failed to converge, increase the number of iterations. warnings.warn( /home/runner/work/strom/strom/.venv/lib/python3.10/site-packages/sklearn/svm/_base.py:1250: ConvergenceWarning: Liblinear failed to converge, increase the number of iterations. warnings.warn( /home/runner/work/strom/strom/.venv/lib/python3.10/site-packages/sklearn/svm/_base.py:1250: ConvergenceWarning: Liblinear failed to converge, increase the number of iterations. warnings.warn( /home/runner/work/strom/strom/.venv/lib/python3.10/site-packages/sklearn/svm/_base.py:1250: ConvergenceWarning: Liblinear failed to converge, increase the number of iterations. warnings.warn( /home/runner/work/strom/strom/.venv/lib/python3.10/site-packages/sklearn/svm/_base.py:1250: ConvergenceWarning: Liblinear failed to converge, increase the number of iterations. warnings.warn( /home/runner/work/strom/strom/.venv/lib/python3.10/site-packages/sklearn/svm/_base.py:1250: ConvergenceWarning: Liblinear failed to converge, increase the number of iterations. warnings.warn( /home/runner/work/strom/strom/.venv/lib/python3.10/site-packages/sklearn/svm/_base.py:1250: ConvergenceWarning: Liblinear failed to converge, increase the number of iterations. warnings.warn( /home/runner/work/strom/strom/.venv/lib/python3.10/site-packages/sklearn/svm/_base.py:1250: ConvergenceWarning: Liblinear failed to converge, increase the number of iterations. warnings.warn( /home/runner/work/strom/strom/.venv/lib/python3.10/site-packages/sklearn/svm/_base.py:1250: ConvergenceWarning: Liblinear failed to converge, increase the number of iterations. warnings.warn( /home/runner/work/strom/strom/.venv/lib/python3.10/site-packages/sklearn/svm/_base.py:1250: ConvergenceWarning: Liblinear failed to converge, increase the number of iterations. warnings.warn( /home/runner/work/strom/strom/.venv/lib/python3.10/site-packages/sklearn/svm/_base.py:1250: ConvergenceWarning: Liblinear failed to converge, increase the number of iterations. warnings.warn( /home/runner/work/strom/strom/.venv/lib/python3.10/site-packages/sklearn/svm/_base.py:1250: ConvergenceWarning: Liblinear failed to converge, increase the number of iterations. warnings.warn( /home/runner/work/strom/strom/.venv/lib/python3.10/site-packages/sklearn/svm/_base.py:1250: ConvergenceWarning: Liblinear failed to converge, increase the number of iterations. warnings.warn( /home/runner/work/strom/strom/.venv/lib/python3.10/site-packages/sklearn/svm/_base.py:1250: ConvergenceWarning: Liblinear failed to converge, increase the number of iterations. warnings.warn( /home/runner/work/strom/strom/.venv/lib/python3.10/site-packages/sklearn/svm/_base.py:1250: ConvergenceWarning: Liblinear failed to converge, increase the number of iterations. warnings.warn( /home/runner/work/strom/strom/.venv/lib/python3.10/site-packages/sklearn/svm/_base.py:1250: ConvergenceWarning: Liblinear failed to converge, increase the number of iterations. warnings.warn( /home/runner/work/strom/strom/.venv/lib/python3.10/site-packages/sklearn/svm/_base.py:1250: ConvergenceWarning: Liblinear failed to converge, increase the number of iterations. warnings.warn( /home/runner/work/strom/strom/.venv/lib/python3.10/site-packages/sklearn/svm/_base.py:1250: ConvergenceWarning: Liblinear failed to converge, increase the number of iterations. warnings.warn( /home/runner/work/strom/strom/.venv/lib/python3.10/site-packages/sklearn/svm/_base.py:1250: ConvergenceWarning: Liblinear failed to converge, increase the number of iterations. warnings.warn( /home/runner/work/strom/strom/.venv/lib/python3.10/site-packages/sklearn/svm/_base.py:1250: ConvergenceWarning: Liblinear failed to converge, increase the number of iterations. warnings.warn( /home/runner/work/strom/strom/.venv/lib/python3.10/site-packages/sklearn/svm/_base.py:1250: ConvergenceWarning: Liblinear failed to converge, increase the number of iterations. warnings.warn( /home/runner/work/strom/strom/.venv/lib/python3.10/site-packages/sklearn/svm/_base.py:1250: ConvergenceWarning: Liblinear failed to converge, increase the number of iterations. warnings.warn( /home/runner/work/strom/strom/.venv/lib/python3.10/site-packages/sklearn/svm/_base.py:1250: ConvergenceWarning: Liblinear failed to converge, increase the number of iterations. warnings.warn( /home/runner/work/strom/strom/.venv/lib/python3.10/site-packages/sklearn/svm/_base.py:1250: ConvergenceWarning: Liblinear failed to converge, increase the number of iterations. warnings.warn( /home/runner/work/strom/strom/.venv/lib/python3.10/site-packages/sklearn/svm/_base.py:1250: ConvergenceWarning: Liblinear failed to converge, increase the number of iterations. warnings.warn( /home/runner/work/strom/strom/.venv/lib/python3.10/site-packages/sklearn/svm/_base.py:1250: ConvergenceWarning: Liblinear failed to converge, increase the number of iterations. warnings.warn( /home/runner/work/strom/strom/.venv/lib/python3.10/site-packages/sklearn/svm/_base.py:1250: ConvergenceWarning: Liblinear failed to converge, increase the number of iterations. warnings.warn( /home/runner/work/strom/strom/.venv/lib/python3.10/site-packages/sklearn/svm/_base.py:1250: ConvergenceWarning: Liblinear failed to converge, increase the number of iterations. warnings.warn( /home/runner/work/strom/strom/.venv/lib/python3.10/site-packages/sklearn/svm/_base.py:1250: ConvergenceWarning: Liblinear failed to converge, increase the number of iterations. warnings.warn( /home/runner/work/strom/strom/.venv/lib/python3.10/site-packages/sklearn/svm/_base.py:1250: ConvergenceWarning: Liblinear failed to converge, increase the number of iterations. warnings.warn( /home/runner/work/strom/strom/.venv/lib/python3.10/site-packages/sklearn/svm/_base.py:1250: ConvergenceWarning: Liblinear failed to converge, increase the number of iterations. warnings.warn( /home/runner/work/strom/strom/.venv/lib/python3.10/site-packages/sklearn/svm/_base.py:1250: ConvergenceWarning: Liblinear failed to converge, increase the number of iterations. warnings.warn( /home/runner/work/strom/strom/.venv/lib/python3.10/site-packages/sklearn/svm/_base.py:1250: ConvergenceWarning: Liblinear failed to converge, increase the number of iterations. warnings.warn( /home/runner/work/strom/strom/.venv/lib/python3.10/site-packages/sklearn/svm/_base.py:1250: ConvergenceWarning: Liblinear failed to converge, increase the number of iterations. warnings.warn( /home/runner/work/strom/strom/.venv/lib/python3.10/site-packages/sklearn/svm/_base.py:1250: ConvergenceWarning: Liblinear failed to converge, increase the number of iterations. warnings.warn( /home/runner/work/strom/strom/.venv/lib/python3.10/site-packages/sklearn/svm/_base.py:1250: ConvergenceWarning: Liblinear failed to converge, increase the number of iterations. warnings.warn( /home/runner/work/strom/strom/.venv/lib/python3.10/site-packages/sklearn/svm/_base.py:1250: ConvergenceWarning: Liblinear failed to converge, increase the number of iterations. warnings.warn( /home/runner/work/strom/strom/.venv/lib/python3.10/site-packages/sklearn/svm/_base.py:1250: ConvergenceWarning: Liblinear failed to converge, increase the number of iterations. warnings.warn( /home/runner/work/strom/strom/.venv/lib/python3.10/site-packages/sklearn/svm/_base.py:1250: ConvergenceWarning: Liblinear failed to converge, increase the number of iterations. warnings.warn( /home/runner/work/strom/strom/.venv/lib/python3.10/site-packages/sklearn/svm/_base.py:1250: ConvergenceWarning: Liblinear failed to converge, increase the number of iterations. ✅ stepit 'grid_search_pipe': Successfully completed and cached [exec time 0.8 seconds, cache time 0.0 seconds, size 28.9 KB] `strom.modelling.grid_search_pipe()` 2026-04-12 13:38:55 Model Cards provide a framework for transparent, responsible reporting. Use the vetiver `.qmd` Quarto template as a place to start, with vetiver.model_card() Writing pin: Name: 'wd-svm' Version: 20260412T133855Z-5376e
⏩ stepit 'svm_tuned': Starting execution of `strom.modelling.assess_model()` 2026-04-12 13:38:55 /home/runner/work/strom/strom/.venv/lib/python3.10/site-packages/sklearn/svm/_base.py:1250: ConvergenceWarning: Liblinear failed to converge, increase the number of iterations. ⏩ stepit 'get_single_split_metrics': Starting execution of `strom.modelling.get_single_split_metrics()` 2026-04-12 13:38:55 ✅ stepit 'get_single_split_metrics': Successfully completed and cached [exec time 0.0 seconds, cache time 0.0 seconds, size 1.0 KB] `strom.modelling.get_single_split_metrics()` 2026-04-12 13:38:55 ⏩ stepit 'cross_validate_pipe': Starting execution of `strom.modelling.cross_validate_pipe()` 2026-04-12 13:38:55 [Parallel(n_jobs=-1)]: Using backend LokyBackend with 4 concurrent workers. /home/runner/work/strom/strom/.venv/lib/python3.10/site-packages/sklearn/svm/_base.py:1250: ConvergenceWarning: Liblinear failed to converge, increase the number of iterations. warnings.warn( /home/runner/work/strom/strom/.venv/lib/python3.10/site-packages/sklearn/svm/_base.py:1250: ConvergenceWarning: Liblinear failed to converge, increase the number of iterations. warnings.warn( /home/runner/work/strom/strom/.venv/lib/python3.10/site-packages/sklearn/svm/_base.py:1250: ConvergenceWarning: Liblinear failed to converge, increase the number of iterations. warnings.warn( /home/runner/work/strom/strom/.venv/lib/python3.10/site-packages/sklearn/svm/_base.py:1250: ConvergenceWarning: Liblinear failed to converge, increase the number of iterations. warnings.warn( /home/runner/work/strom/strom/.venv/lib/python3.10/site-packages/sklearn/svm/_base.py:1250: ConvergenceWarning: Liblinear failed to converge, increase the number of iterations. warnings.warn( [Parallel(n_jobs=-1)]: Done 5 out of 5 | elapsed: 0.1s finished ✅ stepit 'cross_validate_pipe': Successfully completed and cached [exec time 0.1 seconds, cache time 0.0 seconds, size 2.2 KB] `strom.modelling.cross_validate_pipe()` 2026-04-12 13:38:56 ✅ stepit 'svm_tuned': Successfully completed and cached [exec time 0.2 seconds, cache time 0.0 seconds, size 15.8 KB] `strom.modelling.assess_model()` 2026-04-12 13:38:56
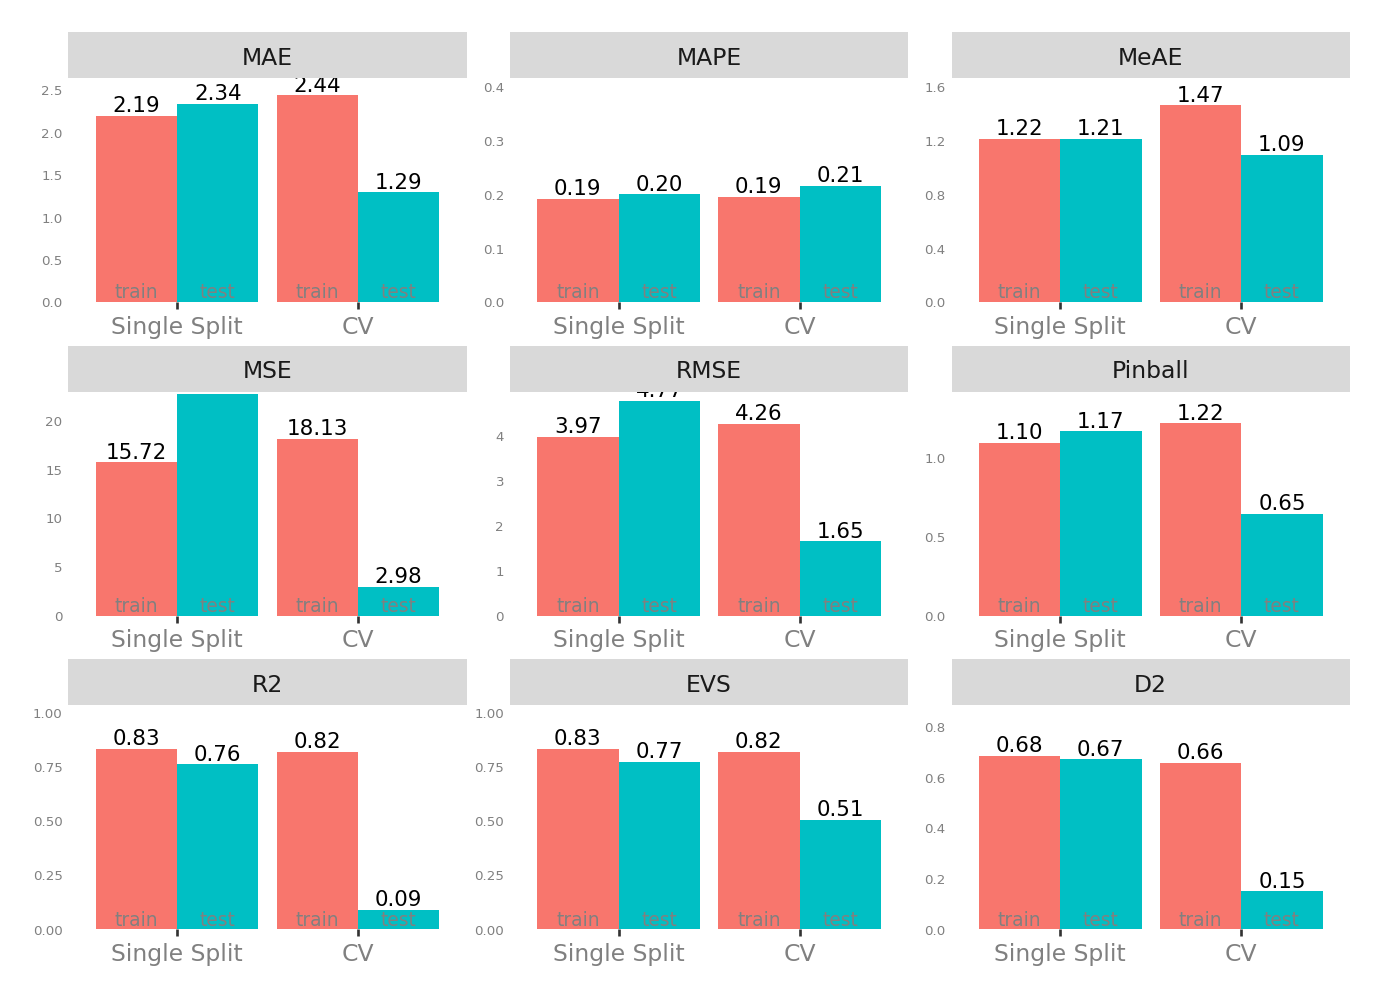
Metrics
| Single Split | CV | |||
|---|---|---|---|---|
| train | test | test | train | |
| MAE - Mean Absolute Error | 2.125402 | 2.222685 | 1.230110 | 2.364933 |
| MSE - Mean Squared Error | 15.449953 | 18.779037 | 2.836818 | 17.703758 |
| RMSE - Root Mean Squared Error | 3.930643 | 4.333479 | 1.581436 | 4.204881 |
| R2 - Coefficient of Determination | 0.834226 | 0.808135 | 0.457556 | 0.821155 |
| MAPE - Mean Absolute Percentage Error | 0.179313 | 0.167911 | 0.179694 | 0.181718 |
| EVS - Explained Variance Score | 0.835730 | 0.814581 | 0.541137 | 0.822873 |
| MeAE - Median Absolute Error | 1.232347 | 1.176013 | 1.006459 | 1.445832 |
| D2 - D2 Absolute Error Score | 0.693164 | 0.710280 | 0.258887 | 0.666975 |
| Pinball - Mean Pinball Loss | 1.062701 | 1.111342 | 0.615055 | 1.182466 |
Scatter plot matrix
Observed vs. Predicted and Residuals vs. Predicted
Check for …
check the residuals to assess the goodness of fit.
- white noise or is there a pattern?
- heteroscedasticity?
- non-linearity?
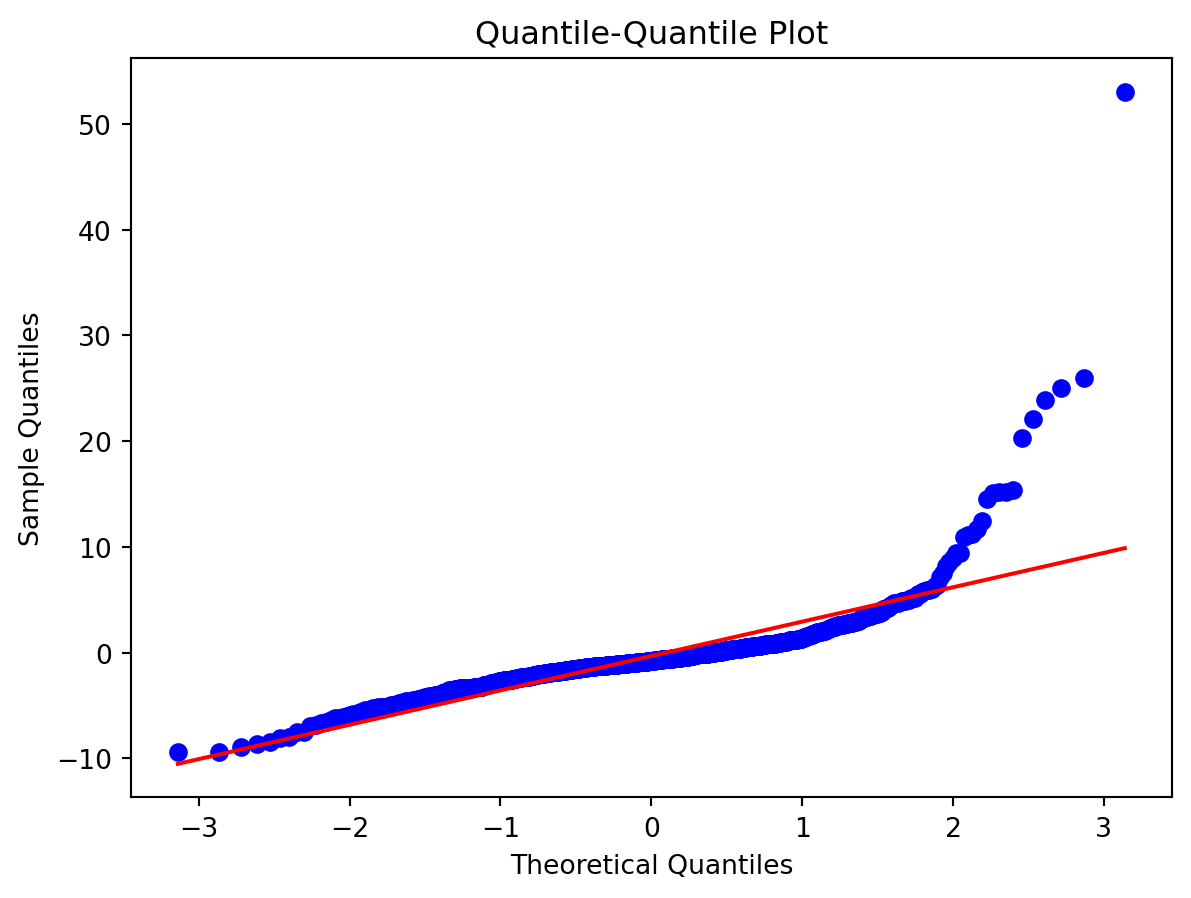
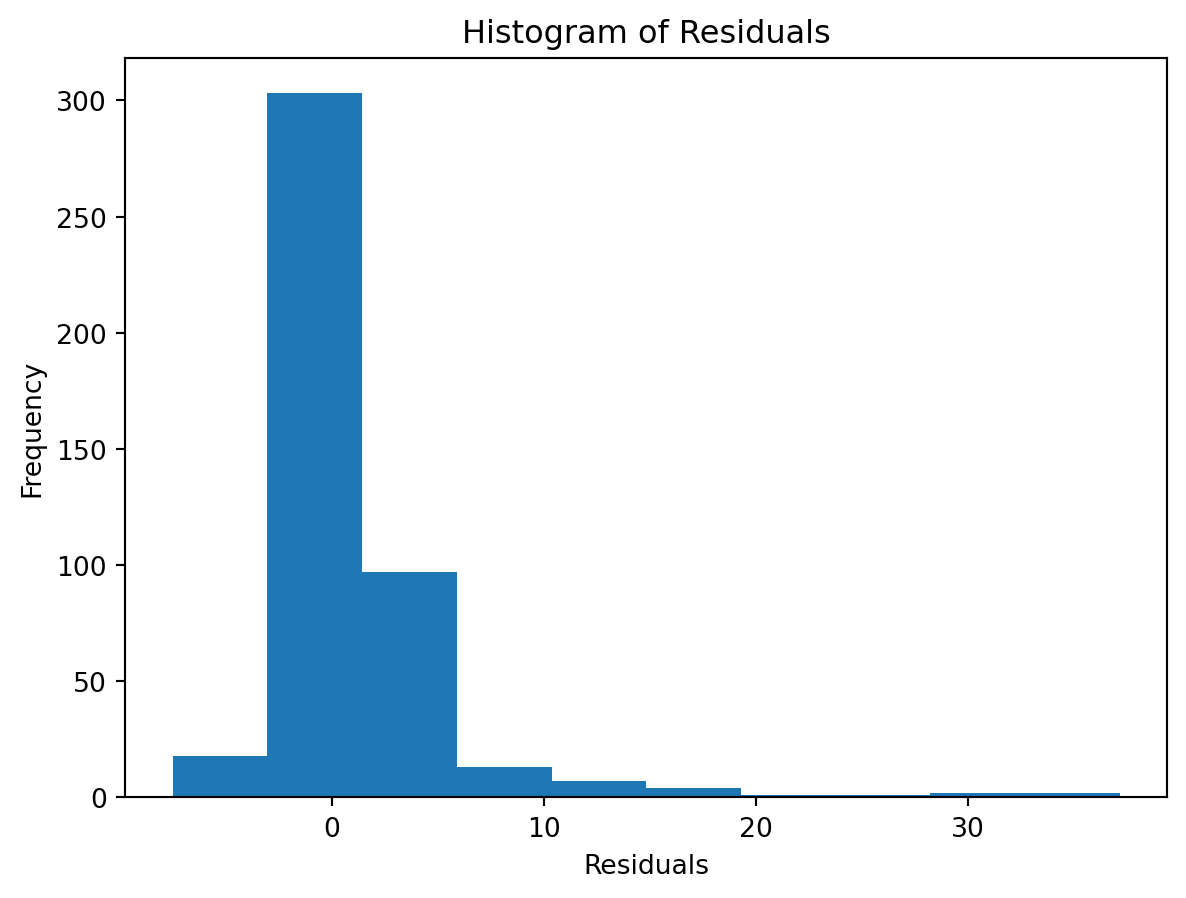
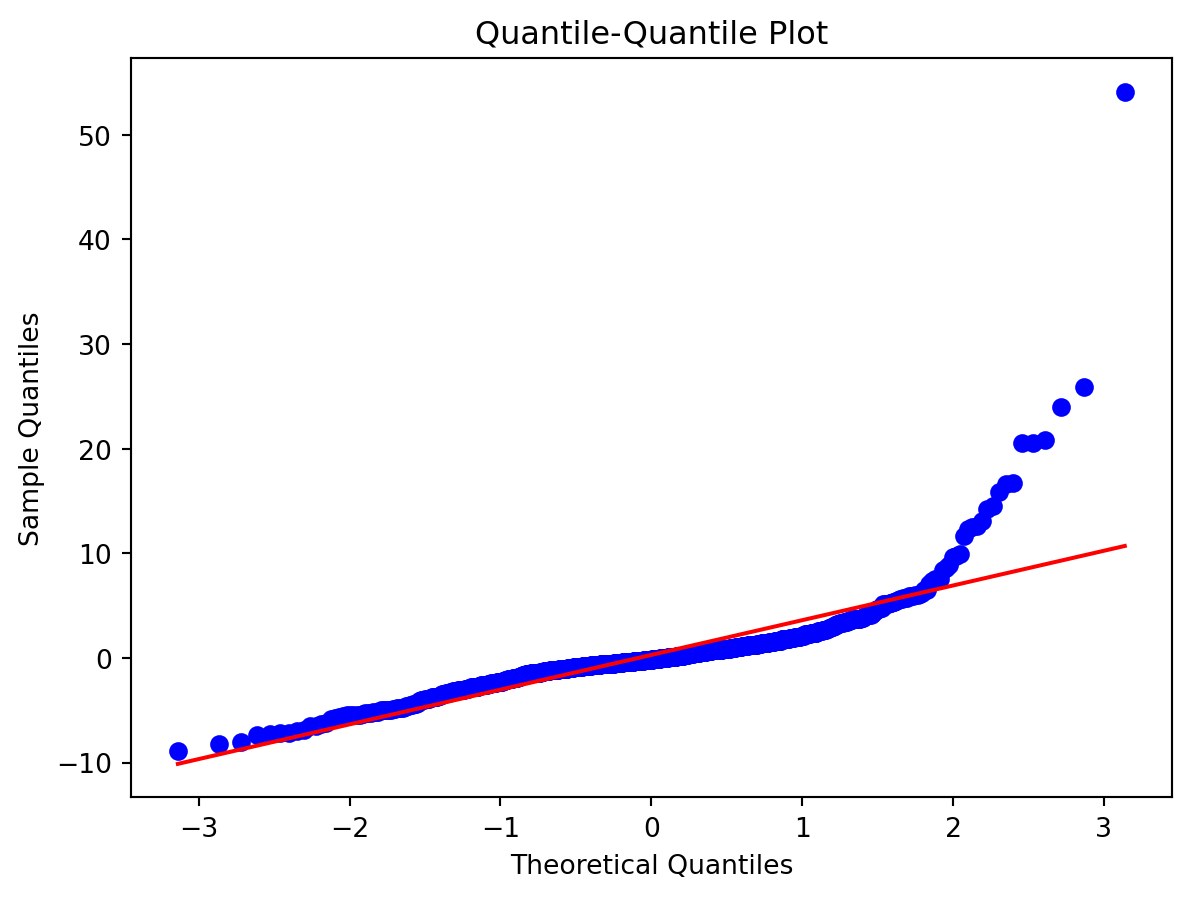
Normality of Residuals:
Check for …
- Are residuals normally distributed?
Leverage
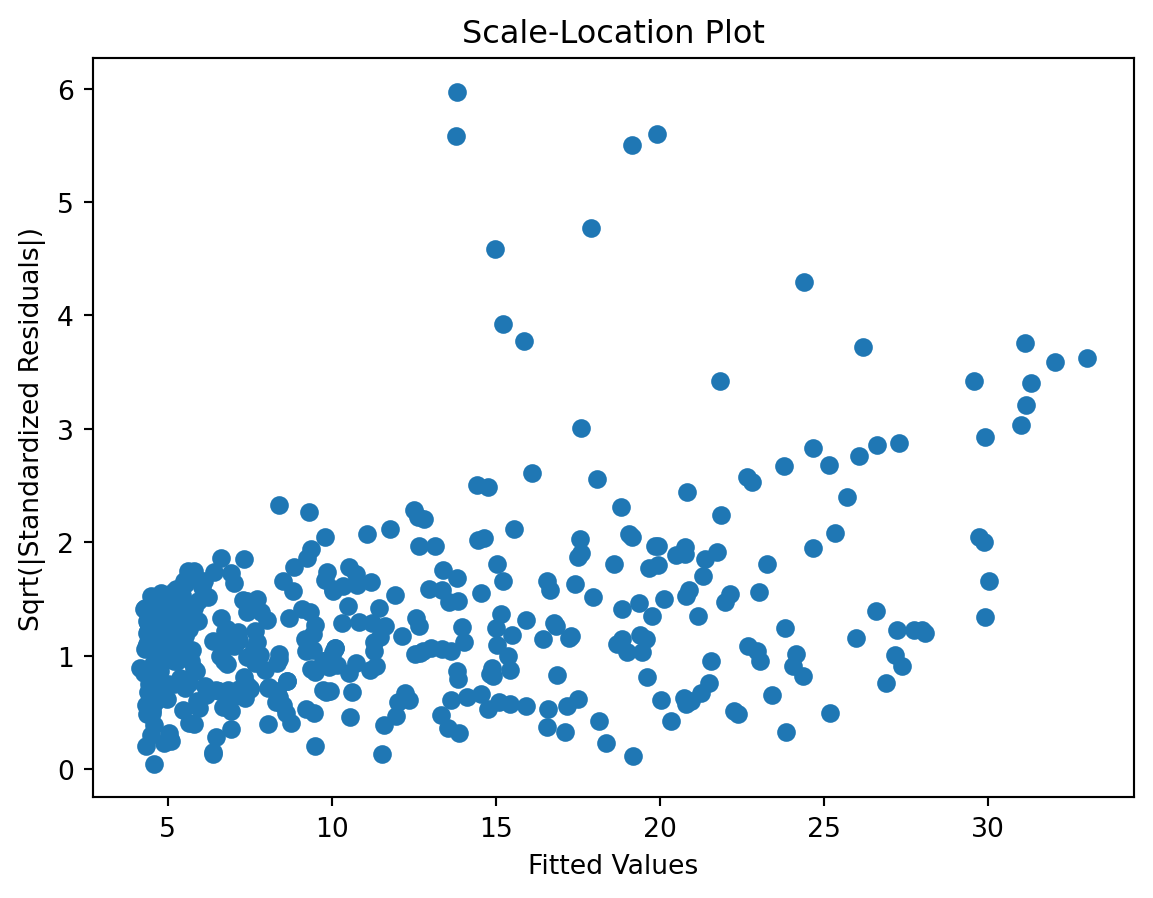
Scale-Location plot
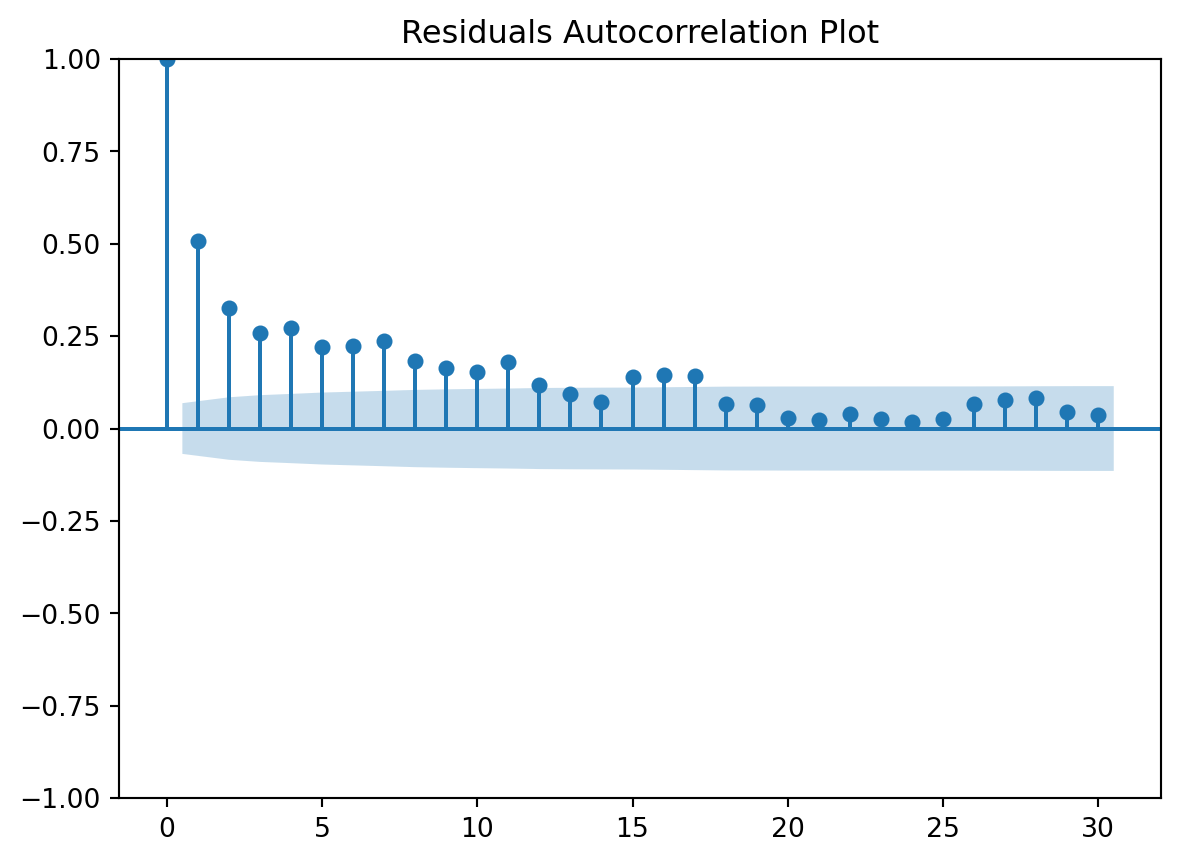
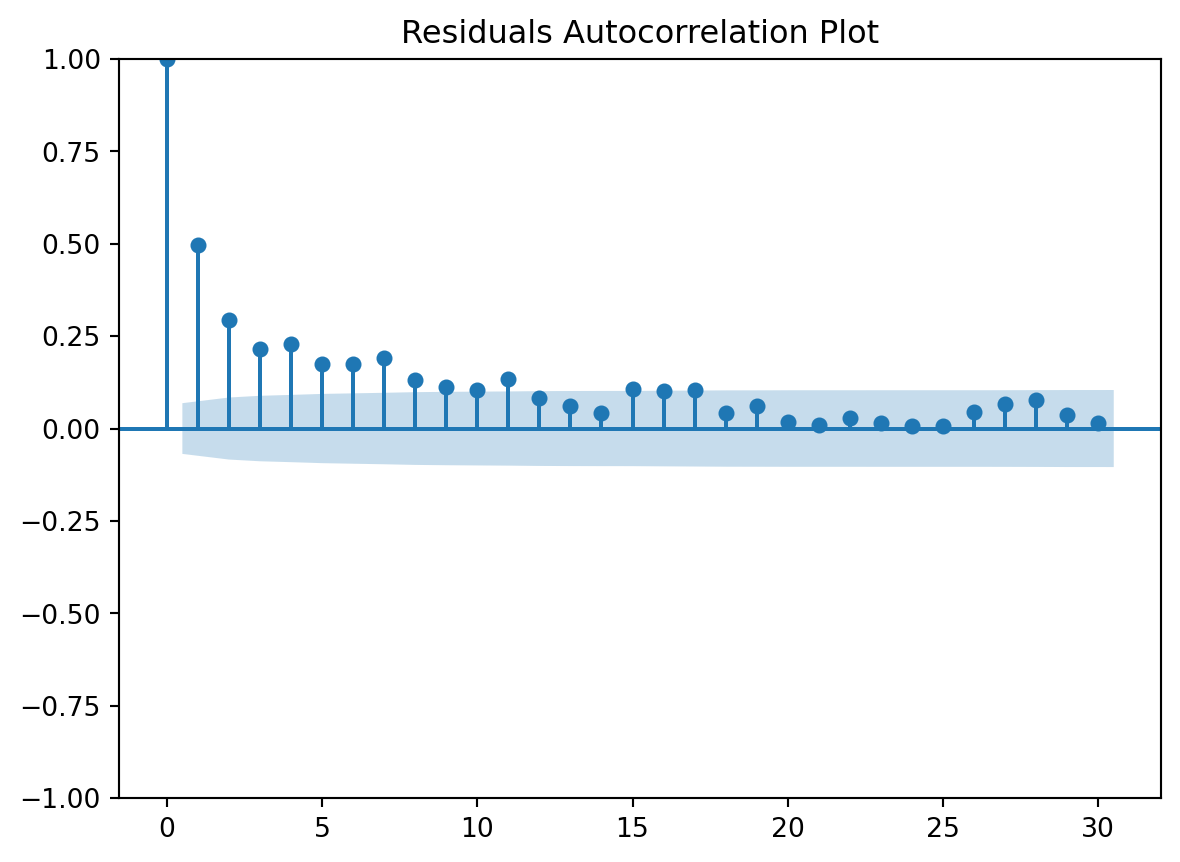
Residuals Autocorrelation Plot