⏩ stepit 'naive': Starting execution of `strom.modelling.assess_model()` 2026-04-12 13:37:03

⏩ stepit 'get_single_split_metrics': Starting execution of `strom.modelling.get_single_split_metrics()` 2026-04-12 13:37:04

✅ stepit 'get_single_split_metrics': Successfully completed and cached [exec time 0.0 seconds, cache time 0.0 seconds, size 1.0 KB] `strom.modelling.get_single_split_metrics()` 2026-04-12 13:37:04

⏩ stepit 'cross_validate_pipe': Starting execution of `strom.modelling.cross_validate_pipe()` 2026-04-12 13:37:04

[Parallel(n_jobs=-1)]: Using backend LokyBackend with 4 concurrent workers.

[Parallel(n_jobs=-1)]: Done   5 out of   5 | elapsed:    2.1s finished

✅ stepit 'cross_validate_pipe': Successfully completed and cached [exec time 2.1 seconds, cache time 0.0 seconds, size 2.2 KB] `strom.modelling.cross_validate_pipe()` 2026-04-12 13:37:06

✅ stepit 'naive': Successfully completed and cached [exec time 2.2 seconds, cache time 0.0 seconds, size 15.7 KB] `strom.modelling.assess_model()` 2026-04-12 13:37:06
Naive Model
Naive model
A simple OLS model with temperature and air humidity, without any transformation or feature engineering -no thinking at all-.
Metrics
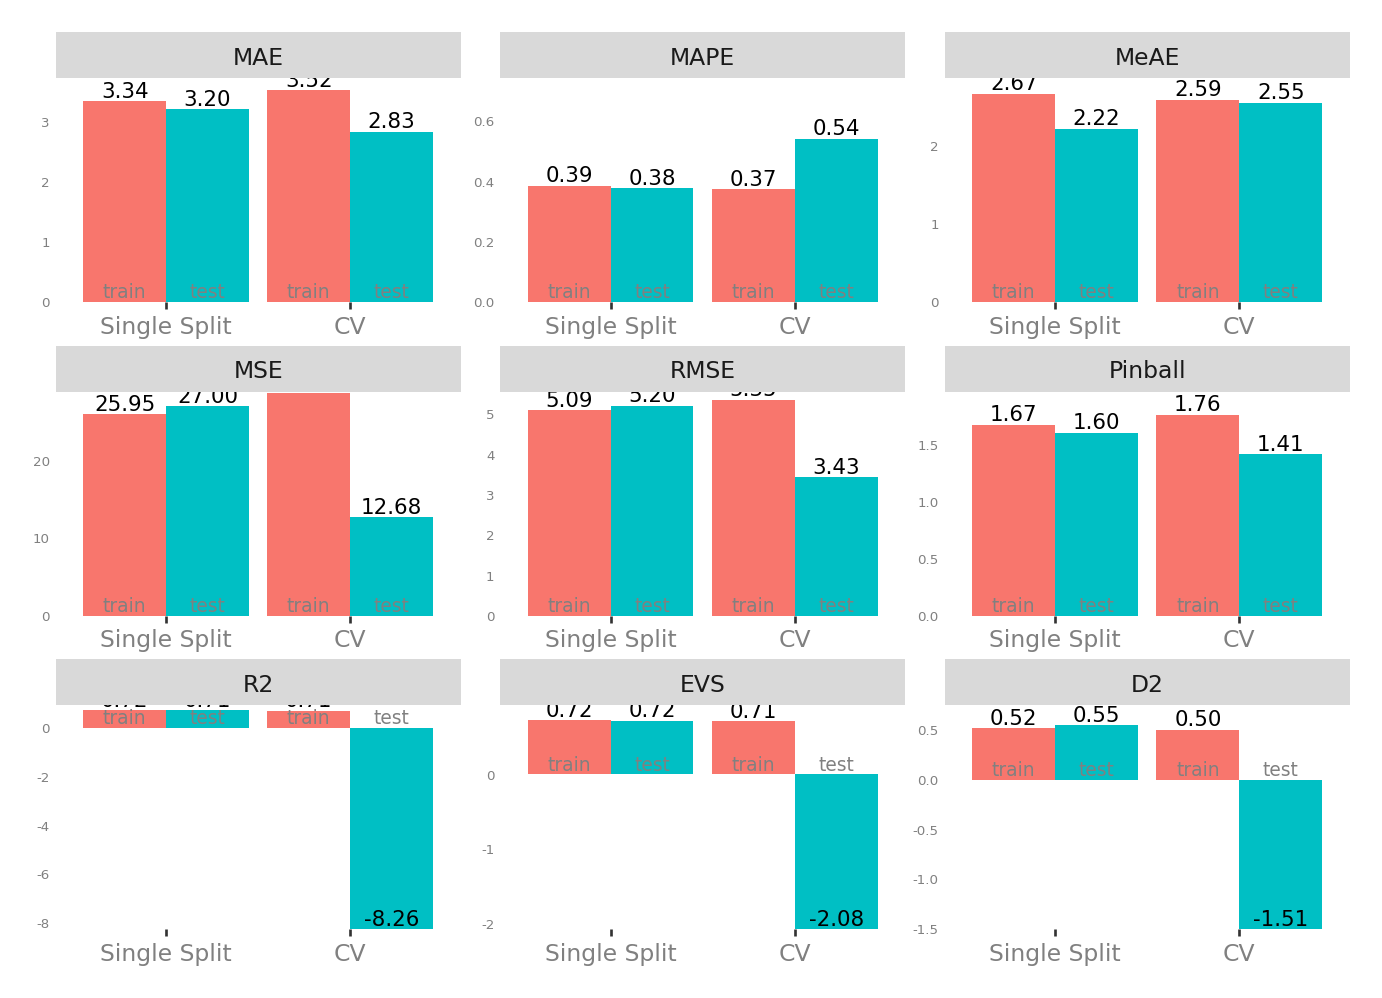
| Single Split | CV | |||
|---|---|---|---|---|
| train | test | test | train | |
| MAE - Mean Absolute Error | 3.340488 | 3.162185 | 2.826249 | 3.521145 |
| MSE - Mean Squared Error | 25.947551 | 24.493693 | 12.676356 | 28.646140 |
| RMSE - Root Mean Squared Error | 5.093874 | 4.949110 | 3.426344 | 5.349381 |
| R2 - Coefficient of Determination | 0.721589 | 0.749748 | -8.271677 | 0.710541 |
| MAPE - Mean Absolute Percentage Error | 0.385556 | 0.325290 | 0.541985 | 0.374222 |
| EVS - Explained Variance Score | 0.721589 | 0.749876 | -2.079990 | 0.710541 |
| MeAE - Median Absolute Error | 2.667506 | 2.272731 | 2.553267 | 2.588375 |
| D2 - D2 Absolute Error Score | 0.517747 | 0.587819 | -1.510111 | 0.504172 |
| Pinball - Mean Pinball Loss | 1.670244 | 1.581092 | 1.413125 | 1.760573 |
Scatter plot matrix
Observed vs. Predicted and Residuals vs. Predicted
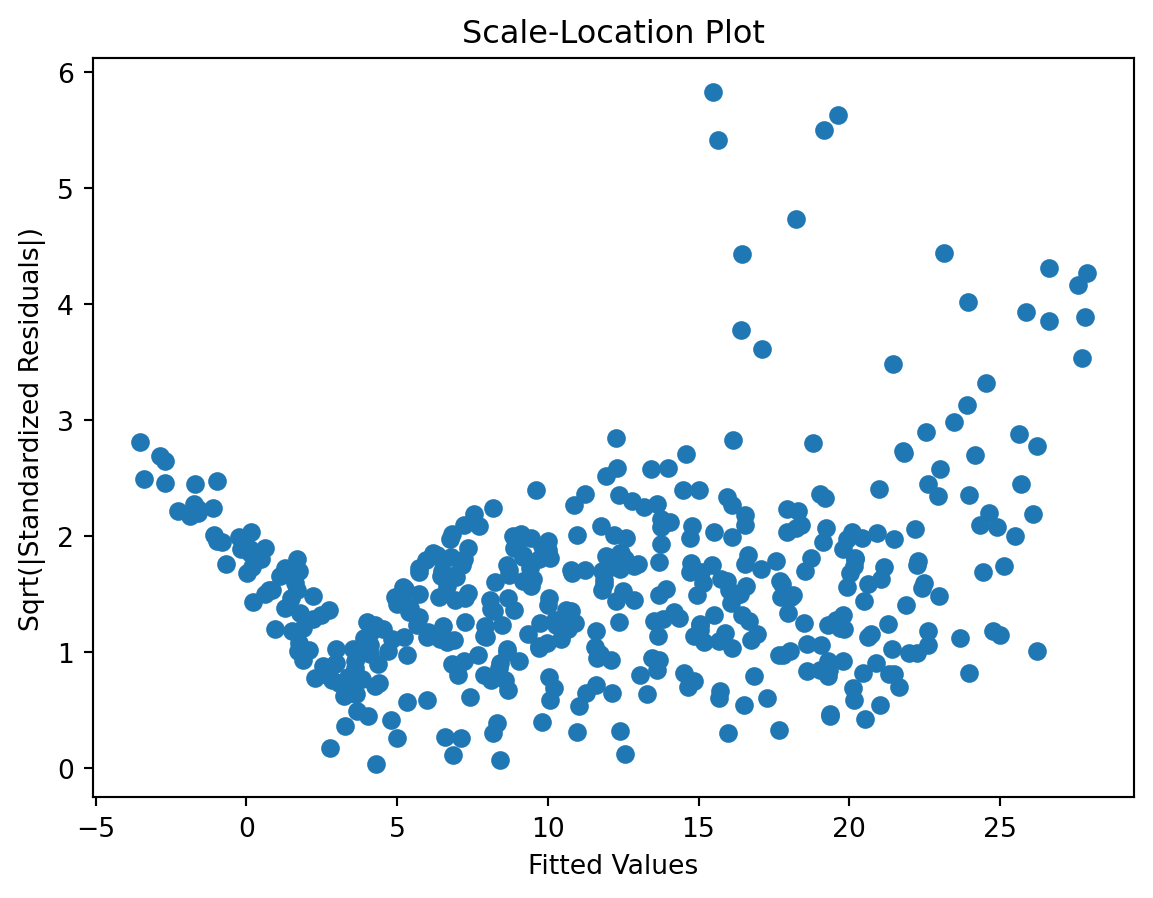
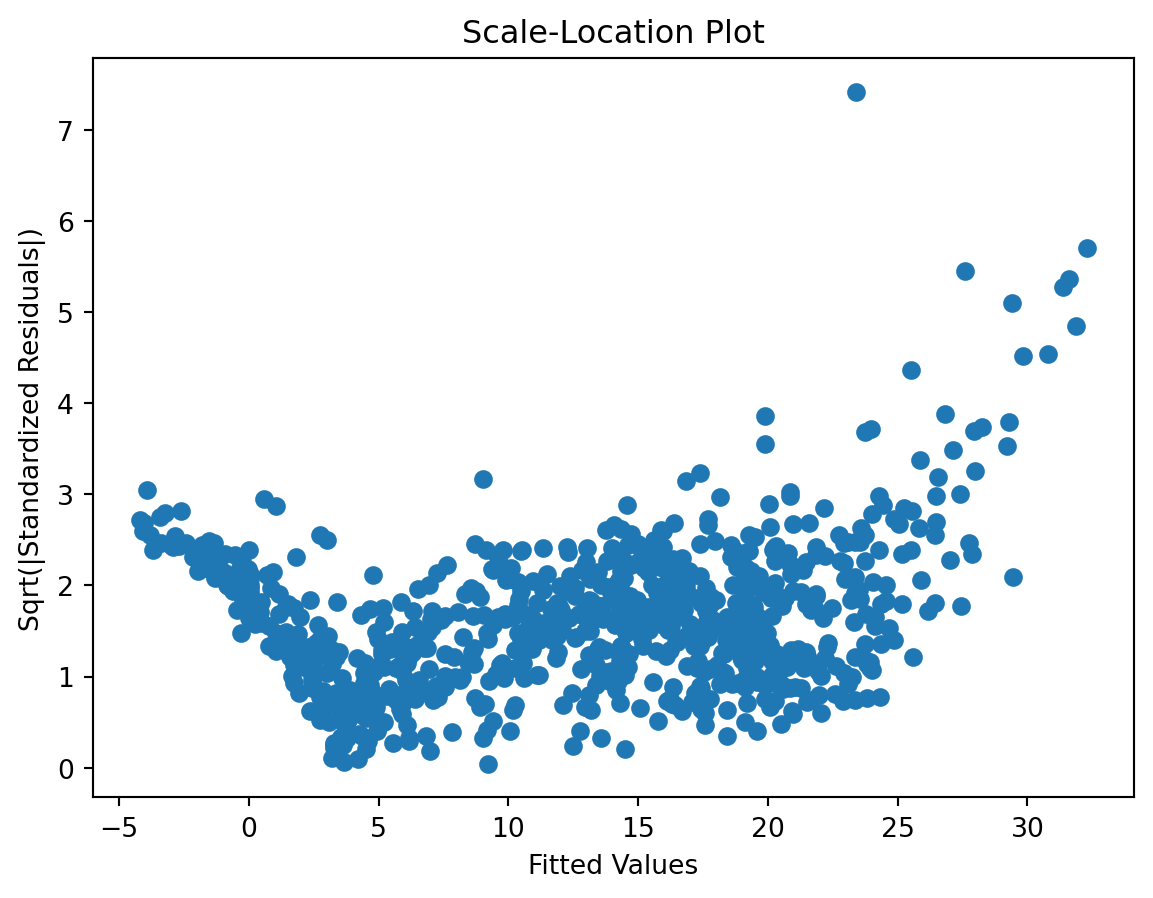
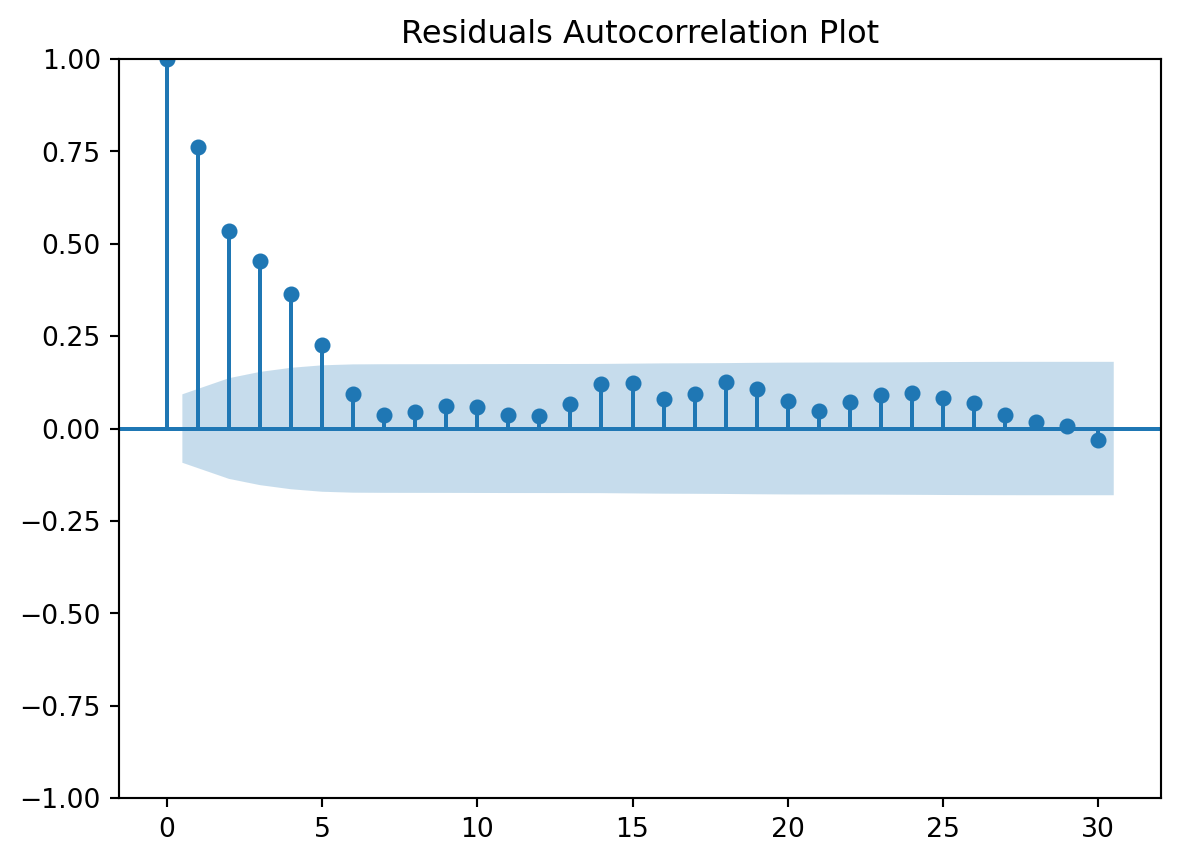
Check for …
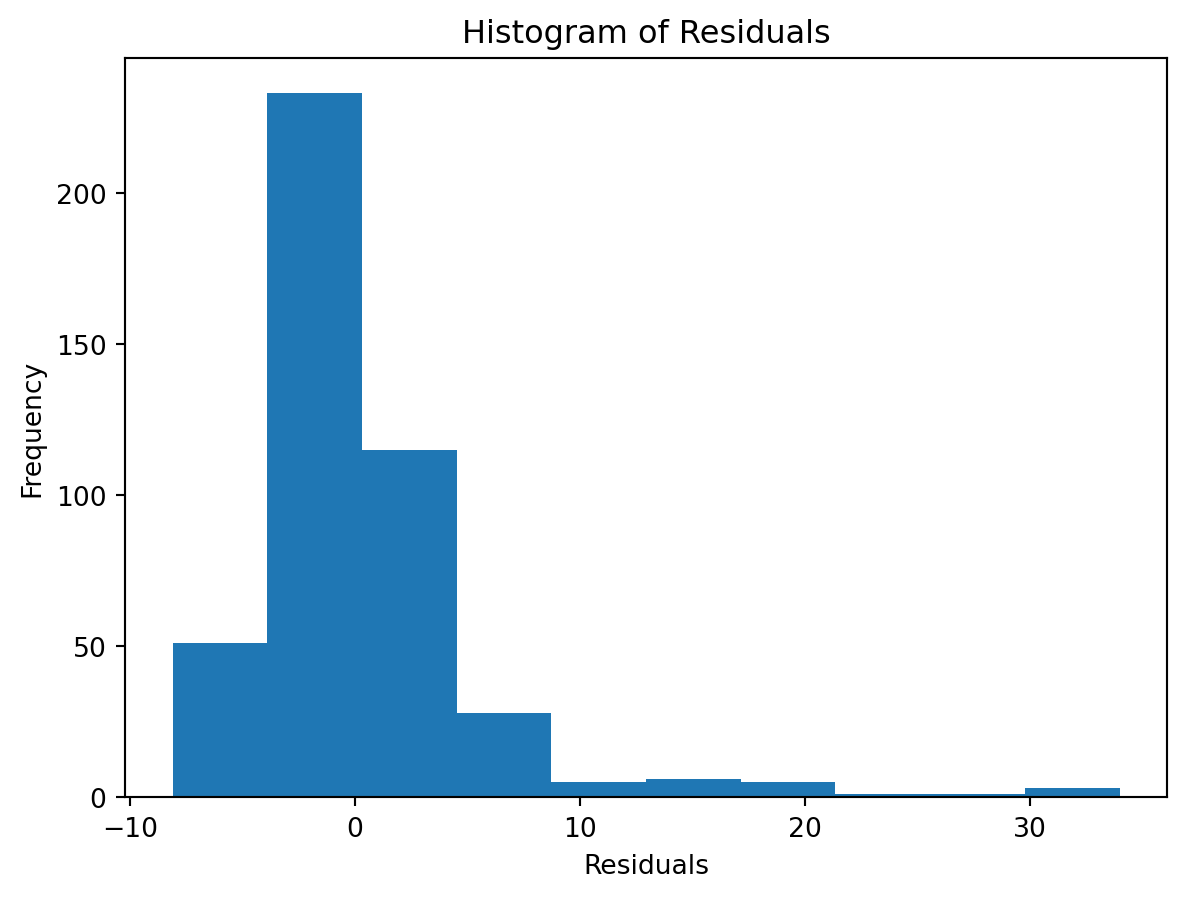
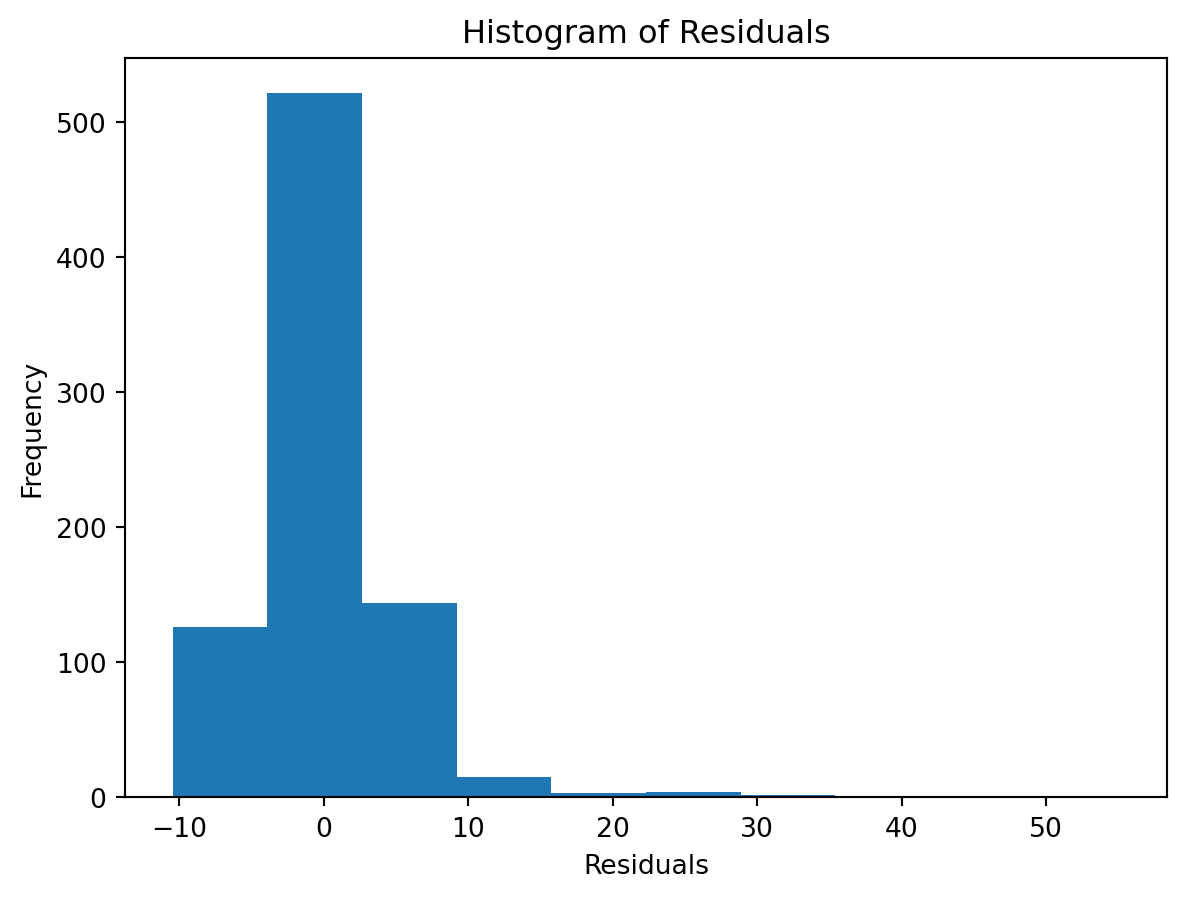
check the residuals to assess the goodness of fit.
- white noise or is there a pattern?
- heteroscedasticity?
- non-linearity?
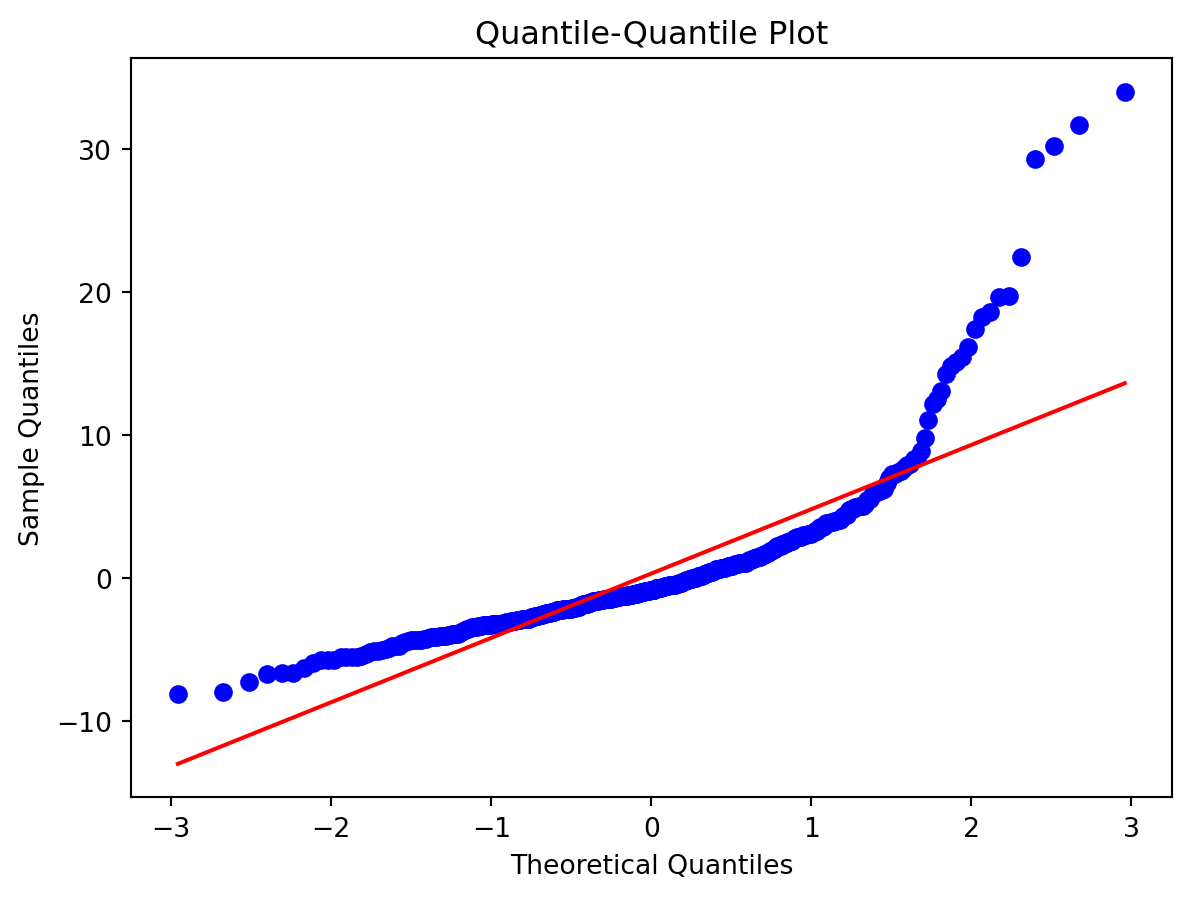
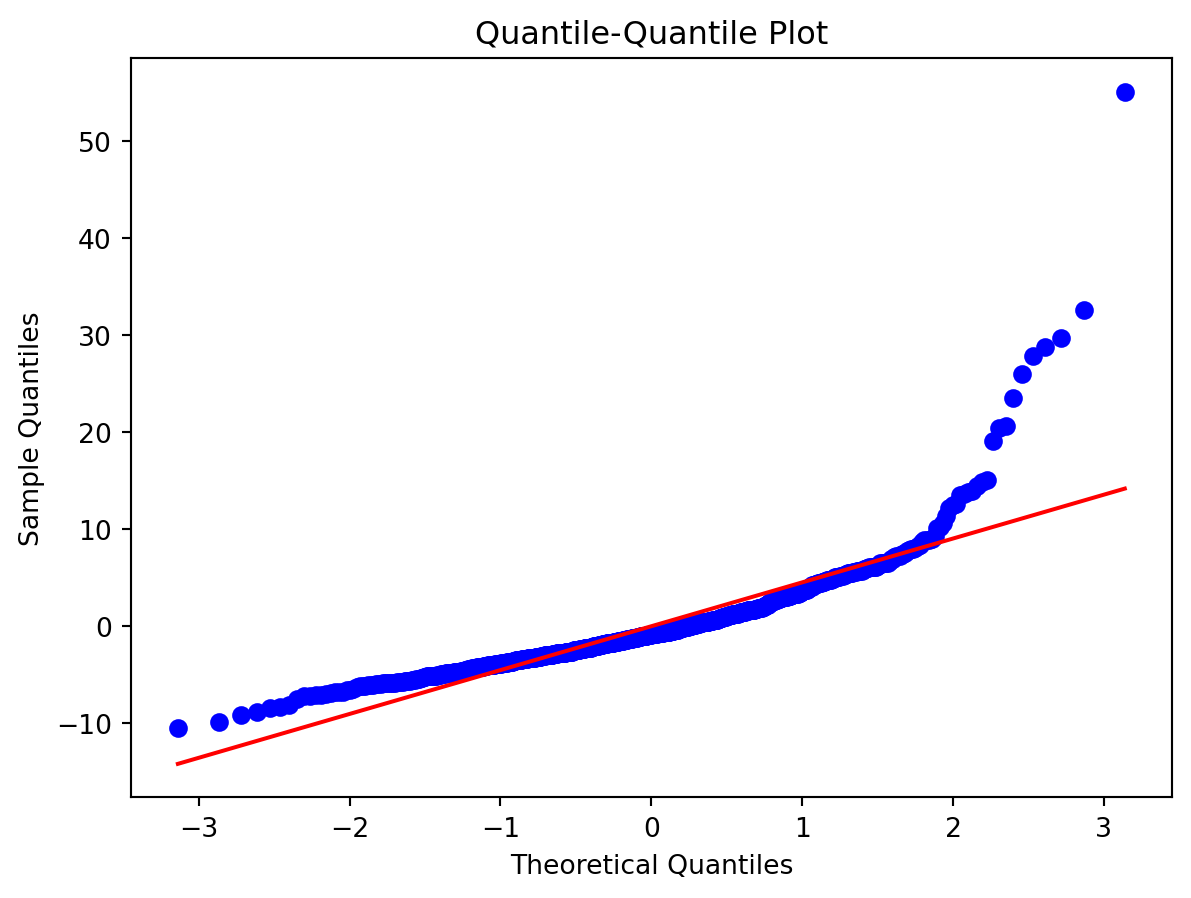
Normality of Residuals:
Check for …
- Are residuals normally distributed?
Leverage
Scale-Location plot
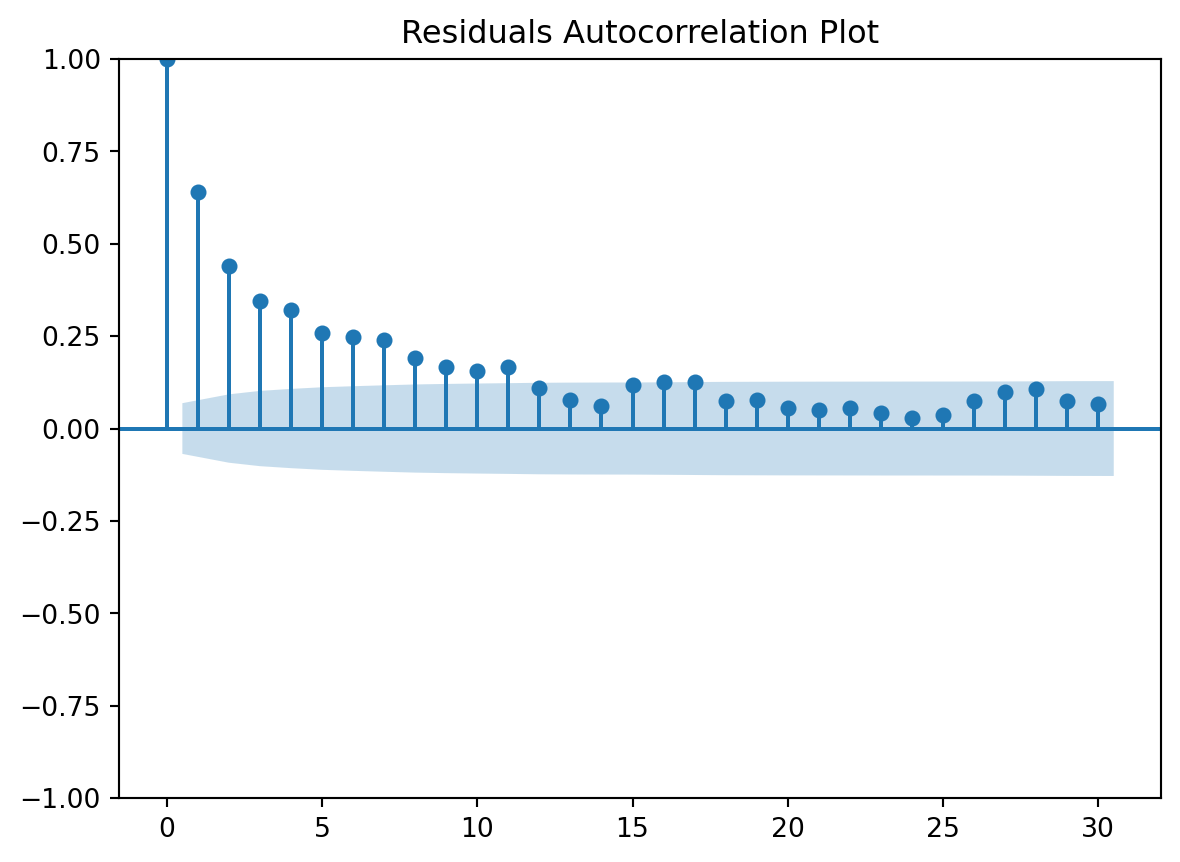
Residuals Autocorrelation Plot
Residuals vs Time
TODOs
Clearly the naive model is not a good fit (as expected).
Naive Model, but using statsmodels …
                            OLS Regression Results
==============================================================================
Dep. Variable:                     wd   R-squared:                       0.737
Model:                            OLS   Adj. R-squared:                  0.737
Method:                 Least Squares   F-statistic:                     1963.
Date:                Sun, 12 Apr 2026   Prob (F-statistic):               0.00
Time:                        13:37:10   Log-Likelihood:                -4259.4
No. Observations:                1405   AIC:                             8525.
Df Residuals:                    1402   BIC:                             8541.
Df Model:                           2
Covariance Type:            nonrobust
==============================================================================
                 coef    std err          t      P>|t|      [0.025      0.975]
------------------------------------------------------------------------------
const         27.9188      1.219     22.899      0.000      25.527      30.310
tt_tu_mean    -1.1363      0.019    -59.272      0.000      -1.174      -1.099
rf_tu_mean    -0.0612      0.014     -4.300      0.000      -0.089      -0.033
==============================================================================
Omnibus:                      979.383   Durbin-Watson:                   0.631
Prob(Omnibus):                  0.000   Jarque-Bera (JB):            21072.270
Skew:                           2.959   Prob(JB):                         0.00
Kurtosis:                      21.026   Cond. No.                         737.
==============================================================================

Notes:
[1] Standard Errors assume that the covariance matrix of the errors is correctly specified.
R-squared: 0.7368832968577501
Naive model, but using scikit-learn without pipeline …