Seasonal-Trend decomposition: Wärmestrom
Wärmestrom
Seasonal-Trend decomposition using LOESS (STL)
Quick and dirty STL. Probably not much insight from it, because the serie is too short to really capture the main seasonality pattern (e.g. year, heizperiode/sommer)
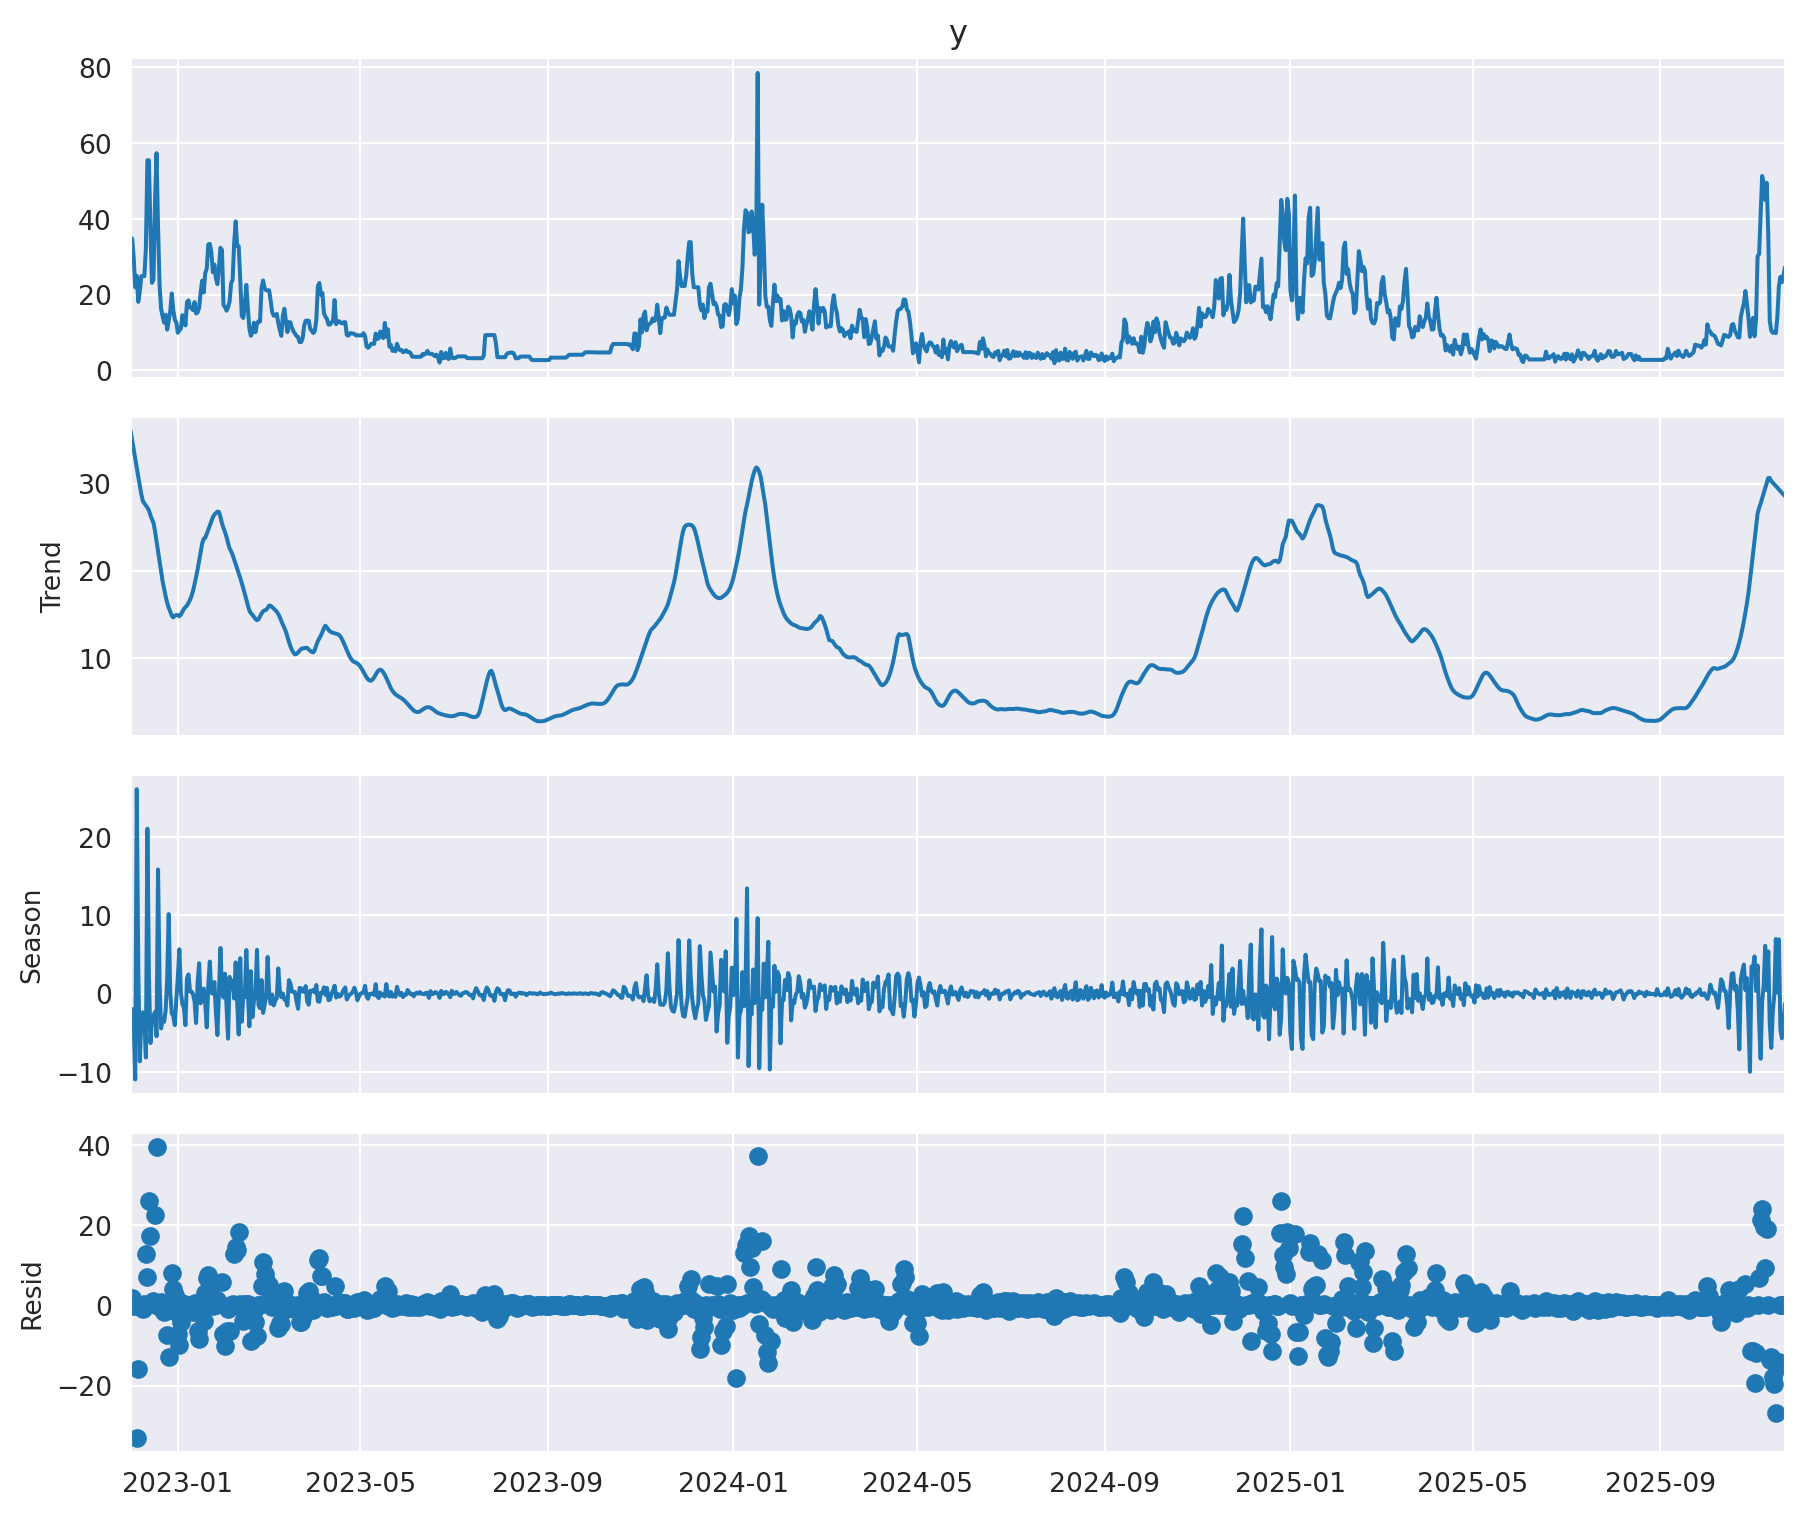
It seems to show some pattern, although that changes in time. Let’s see the raw data per week.
Well, on average, very small changes (~ 1 Kwh), somewhat higher on wednesday and the weekend, and somewhat lower on Thursday and Friday. But this is a very weak signal amid a lot of noise, comming from the changes through the year.
Now let’s see the raw data within a month.
Again, weak signal and a lot of noise. Some pattern in there, but apparently also strongly influenced by outliers.
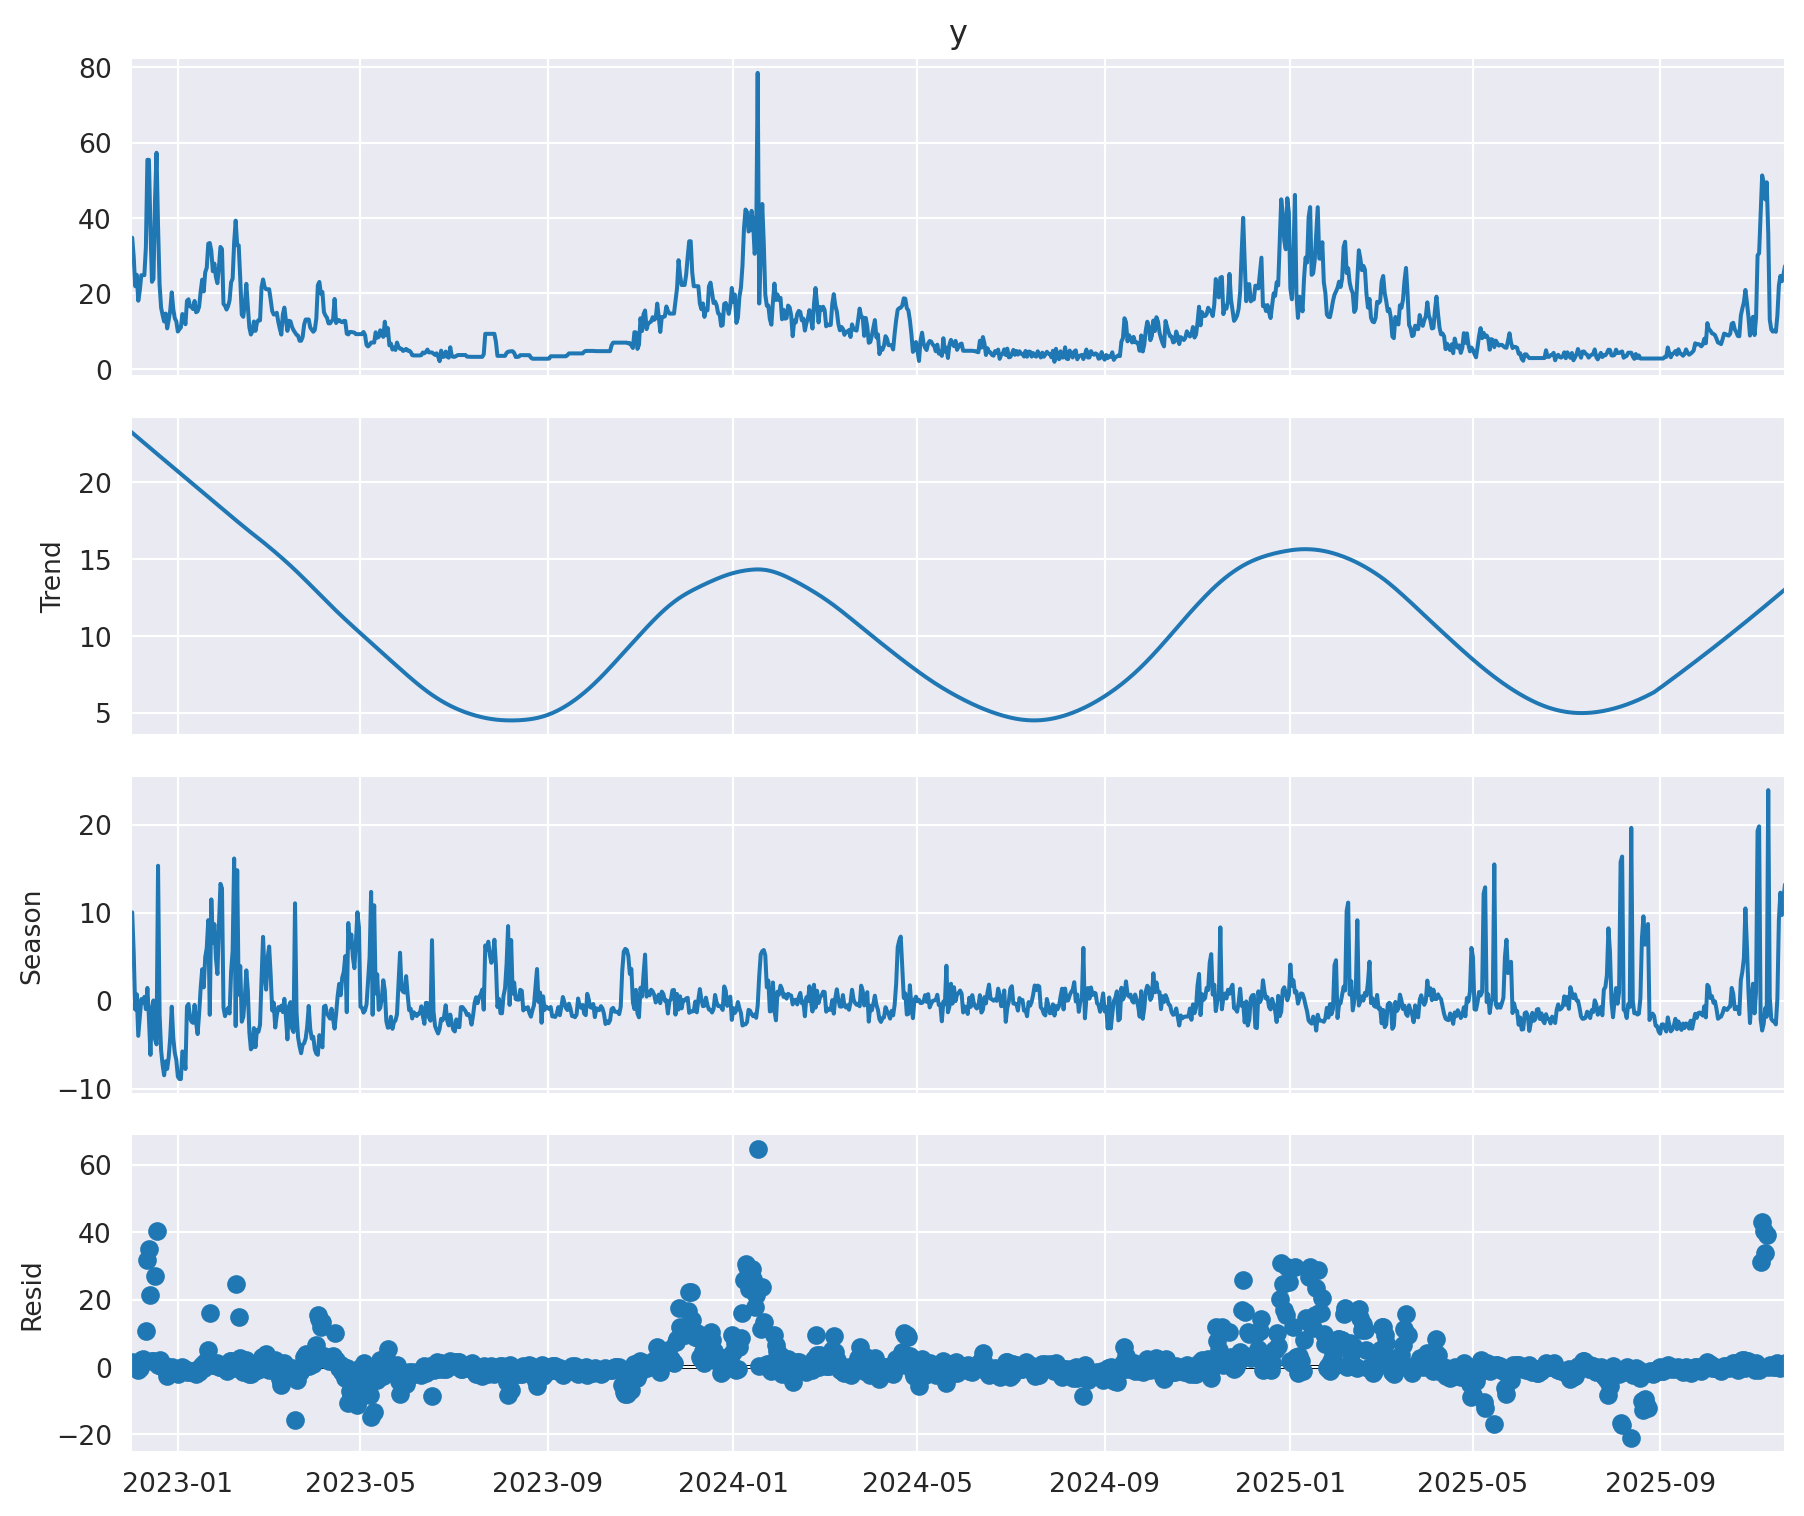
And finally, take a look at the seasonality that should mostly drive the game here.
As expected here you can clearly see the pattern. The serie is but too short to pass year seasonality to STL, but, yeah, perhaps 90 days at least can try to approximate the heating-period vs. warmer period. Let’s see
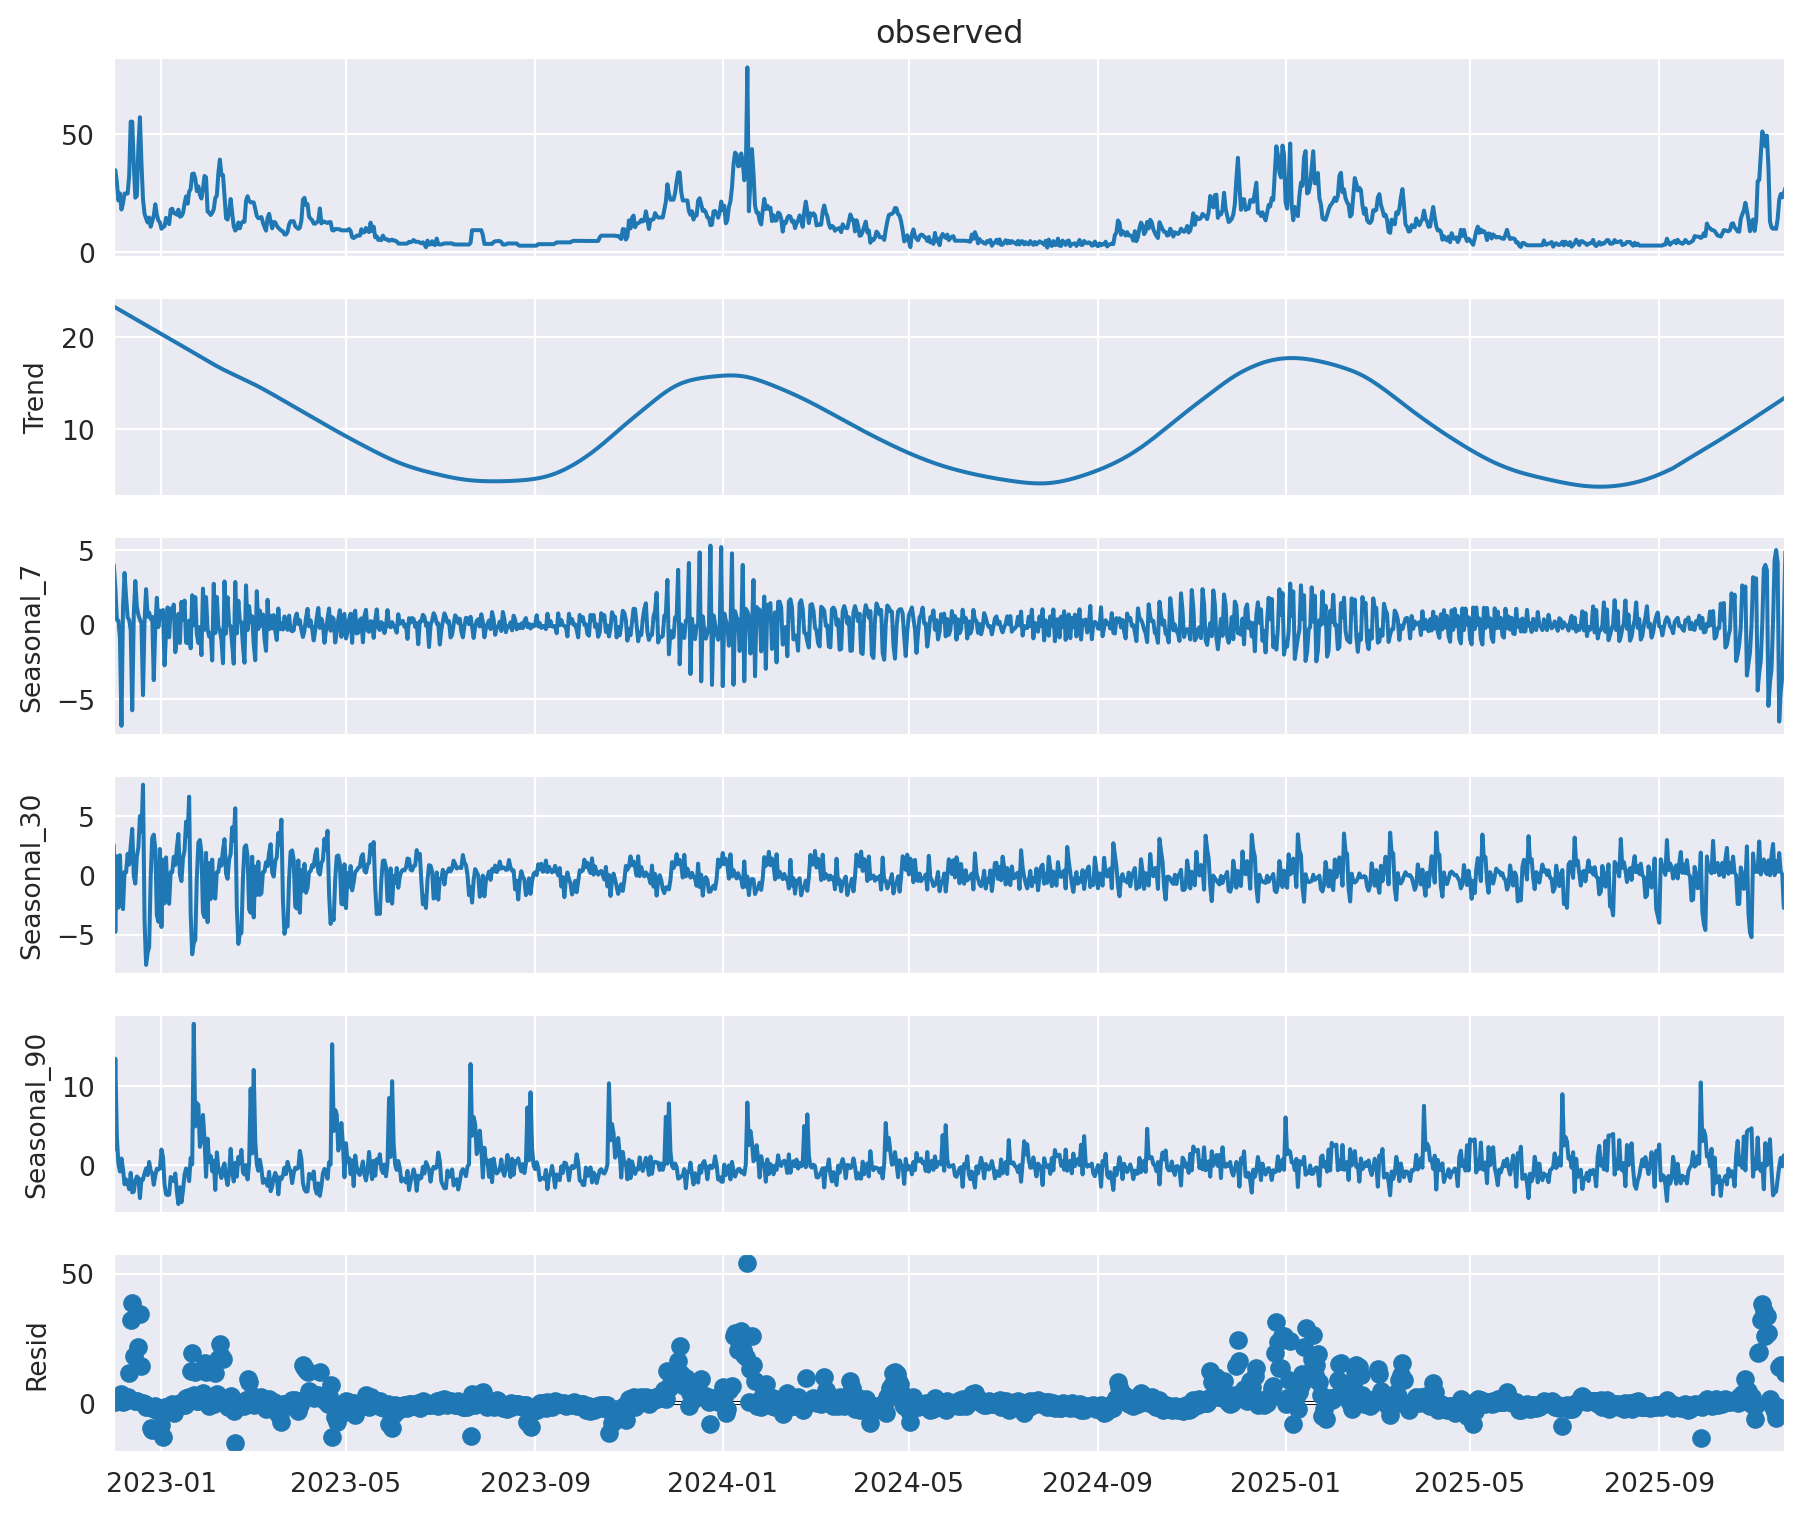
Does the week signal for the shorter periods justify using MSTL here?
Multiple Seasonal-Trend decomposition using LOESS (MSTL)
Prophet
Prophet shoud make it pretty straightforward to do something similar.
Ok, that’s not bad. But even though I increased the trend flexibility, it tends to underfit and smooth out the short-term variations, that are probably legit (e.g. due to temperature changes within cold season)
Loading ITables v2.5.2 from the init_notebook_mode cell...
(need help?) |
{'changepoint_prior_scale': 0.1, 'seasonality_prior_scale': 0.01}