Model Cards provide a framework for transparent, responsible reporting.
Use the vetiver `.qmd` Quarto template as a place to start,
with vetiver.model_card()
Writing pin:
Name: 'wd-gb'
Version: 20260412T133812Z-bfd24Gradient Boost
Before moving forward with the to-do list, let’s throw a Random Forest to it.
Gradient boost
For many reasons, Random Forest is usually a very good baseline model. In this particular case I started with the polynomial OLS as baseline model, just because it was so evident from the correlations that the relationship between temperature and consumption follows a polynomial shape. But let’s go back to a beloved RF.
⏩ stepit 'gb_raw': Starting execution of `strom.modelling.assess_model()` 2026-04-12 13:38:12 ⏩ stepit 'get_single_split_metrics': Starting execution of `strom.modelling.get_single_split_metrics()` 2026-04-12 13:38:12 ✅ stepit 'get_single_split_metrics': Successfully completed and cached [exec time 0.0 seconds, cache time 0.0 seconds, size 1.0 KB] `strom.modelling.get_single_split_metrics()` 2026-04-12 13:38:12 ⏩ stepit 'cross_validate_pipe': Starting execution of `strom.modelling.cross_validate_pipe()` 2026-04-12 13:38:12 [Parallel(n_jobs=-1)]: Using backend LokyBackend with 4 concurrent workers. [Parallel(n_jobs=-1)]: Done 5 out of 5 | elapsed: 2.4s finished ✅ stepit 'cross_validate_pipe': Successfully completed and cached [exec time 2.4 seconds, cache time 0.0 seconds, size 2.2 KB] `strom.modelling.cross_validate_pipe()` 2026-04-12 13:38:14 ✅ stepit 'gb_raw': Successfully completed and cached [exec time 2.6 seconds, cache time 0.0 seconds, size 143.3 KB] `strom.modelling.assess_model()` 2026-04-12 13:38:14
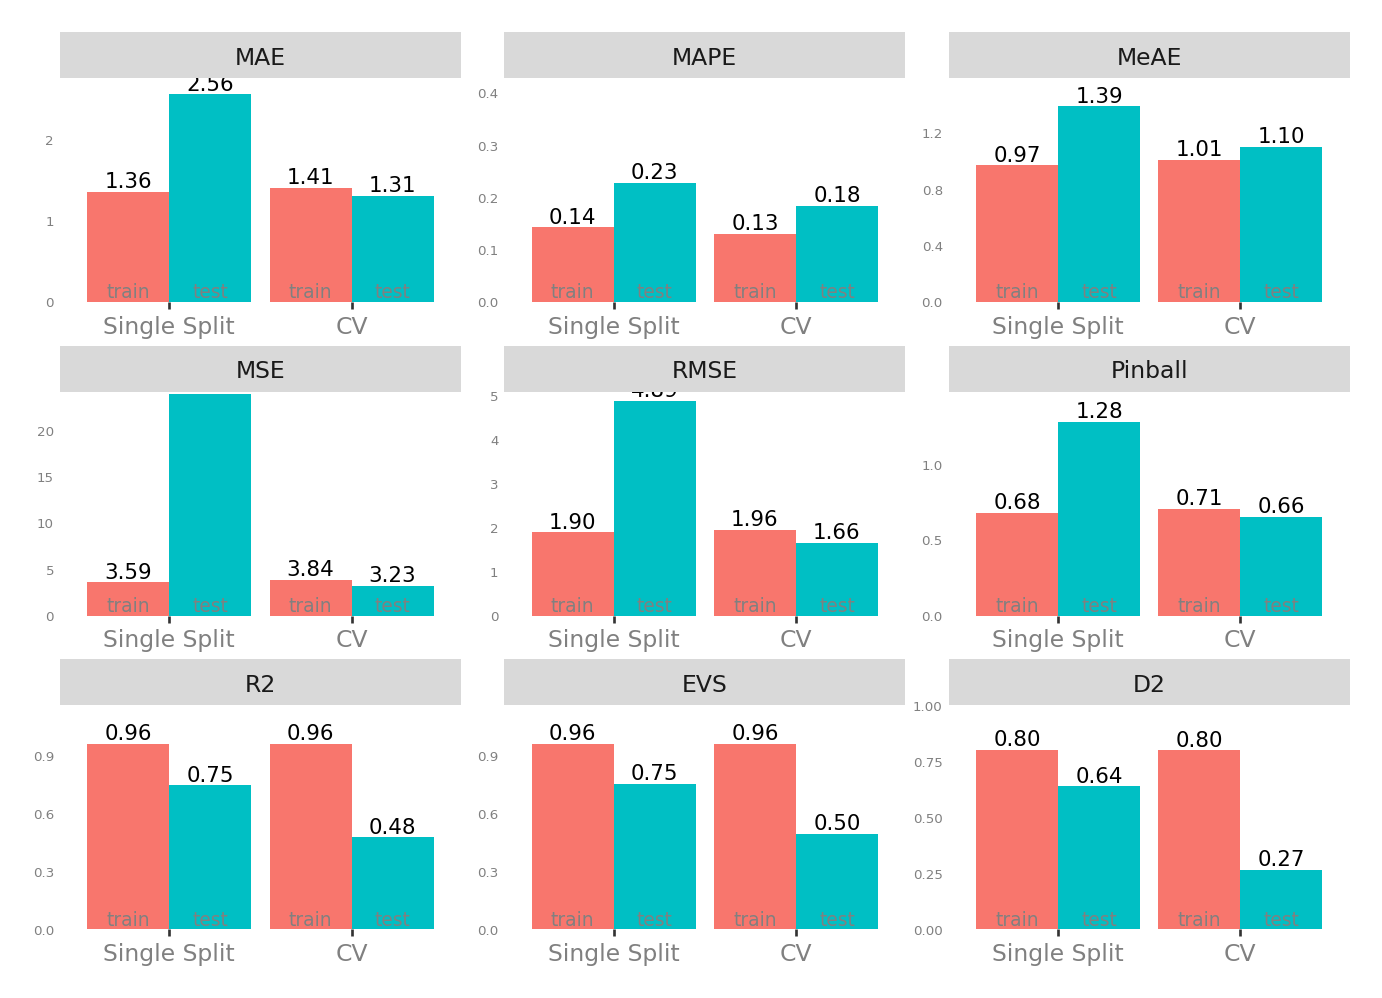
Metrics
| Single Split | CV | |||
|---|---|---|---|---|
| train | test | test | train | |
| MAE - Mean Absolute Error | 1.369728 | 2.738930 | 1.350689 | 1.416835 |
| MSE - Mean Squared Error | 3.646699 | 24.749657 | 3.453944 | 3.855885 |
| RMSE - Root Mean Squared Error | 1.909633 | 4.974903 | 1.711255 | 1.963549 |
| R2 - Coefficient of Determination | 0.960872 | 0.747133 | 0.443621 | 0.960938 |
| MAPE - Mean Absolute Percentage Error | 0.143143 | 0.211137 | 0.188958 | 0.130665 |
| EVS - Explained Variance Score | 0.960872 | 0.747492 | 0.459413 | 0.960938 |
| MeAE - Median Absolute Error | 0.970735 | 1.551477 | 1.128393 | 1.008654 |
| D2 - D2 Absolute Error Score | 0.802258 | 0.642989 | 0.239961 | 0.800228 |
| Pinball - Mean Pinball Loss | 0.684864 | 1.369465 | 0.675345 | 0.708417 |
Scatter plot matrix
Observed vs. Predicted and Residuals vs. Predicted
Check for …
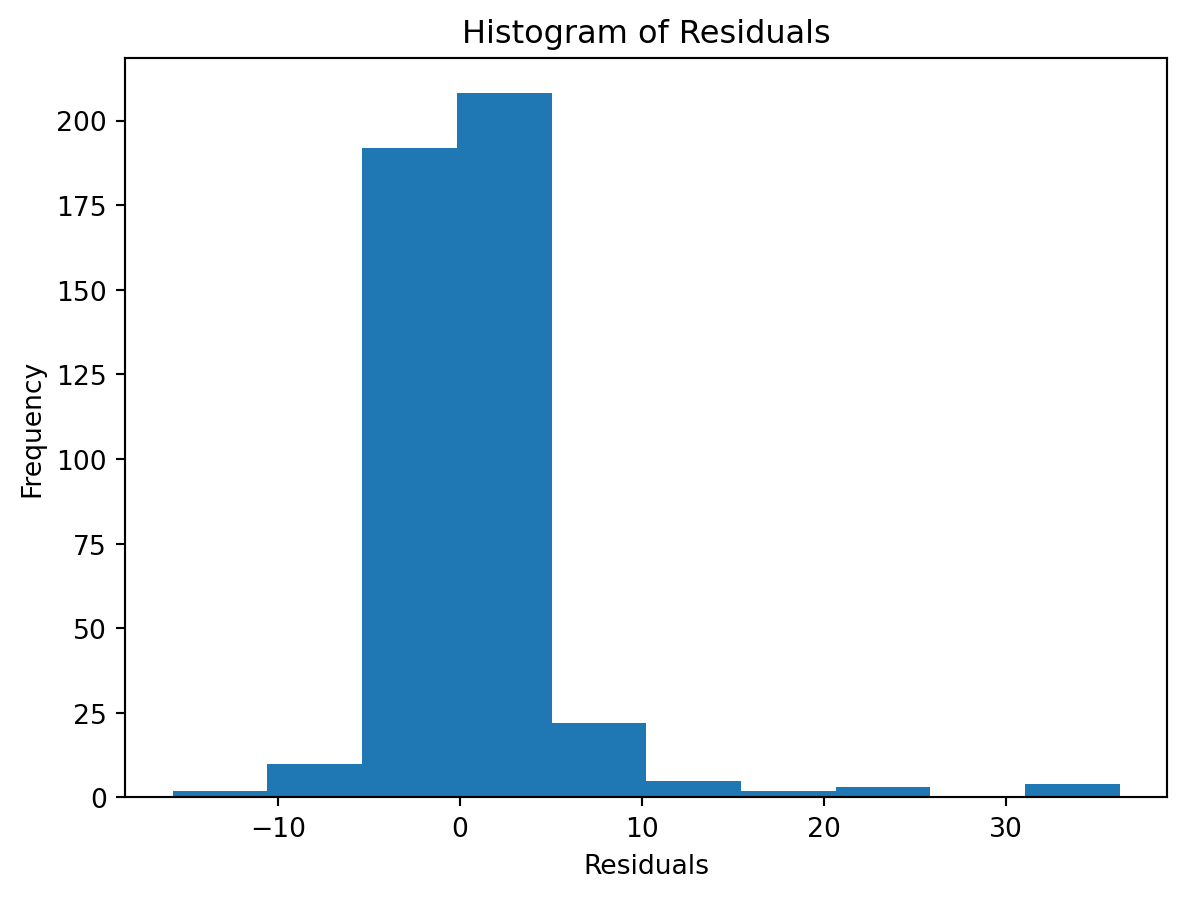
check the residuals to assess the goodness of fit.
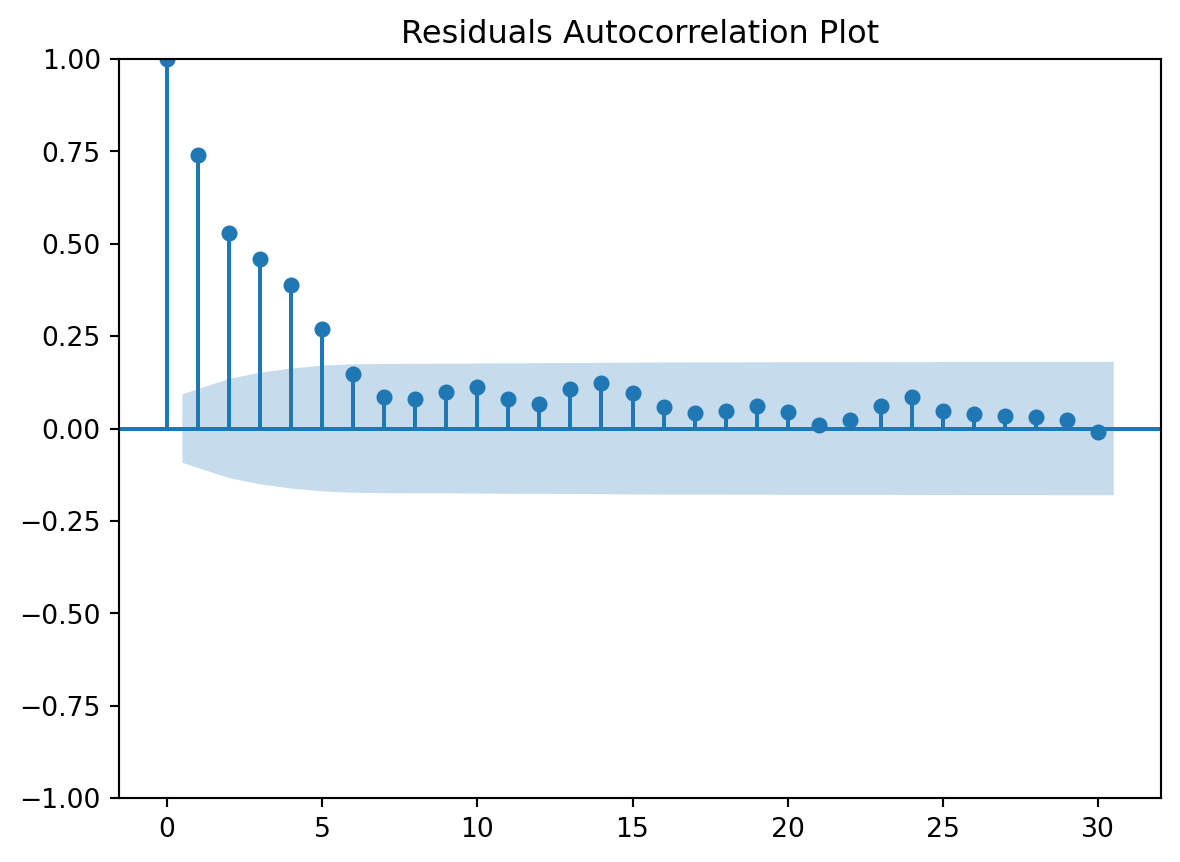
- white noise or is there a pattern?
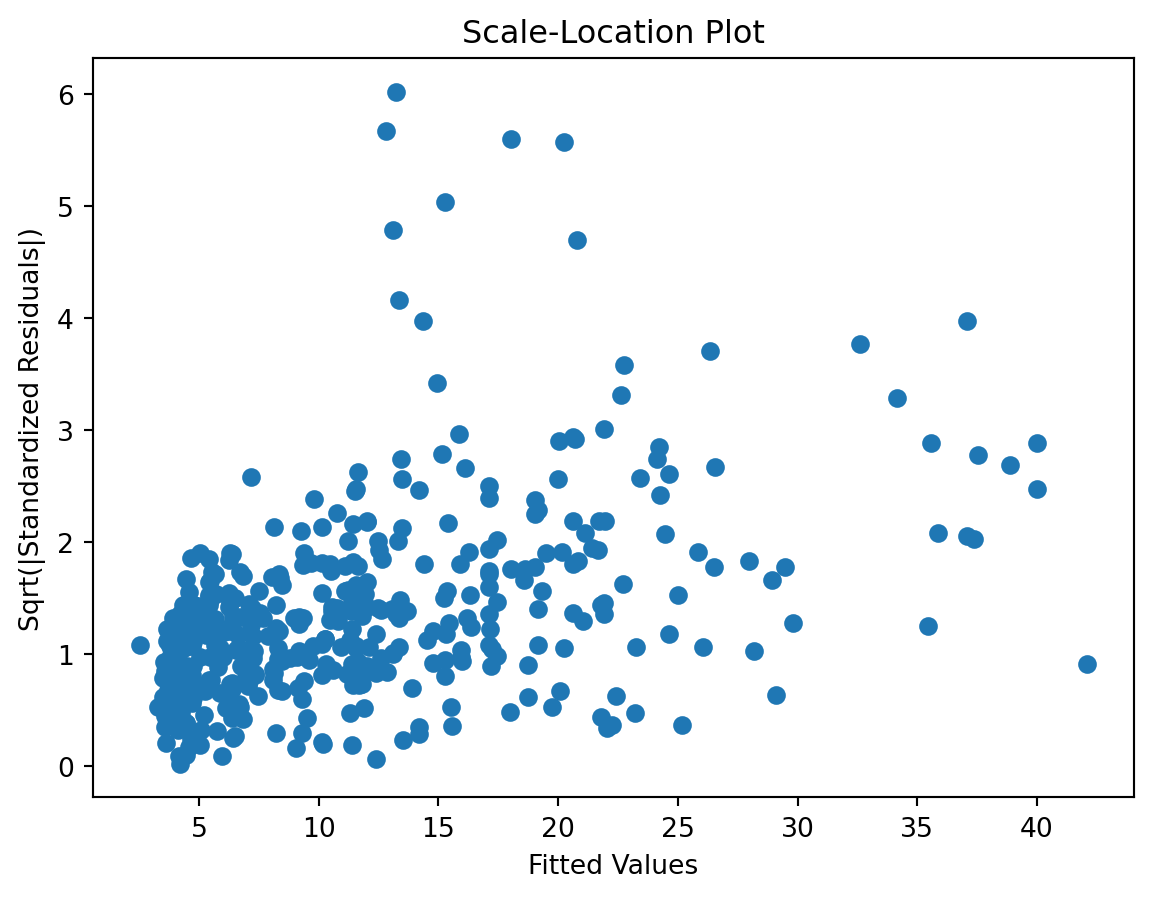
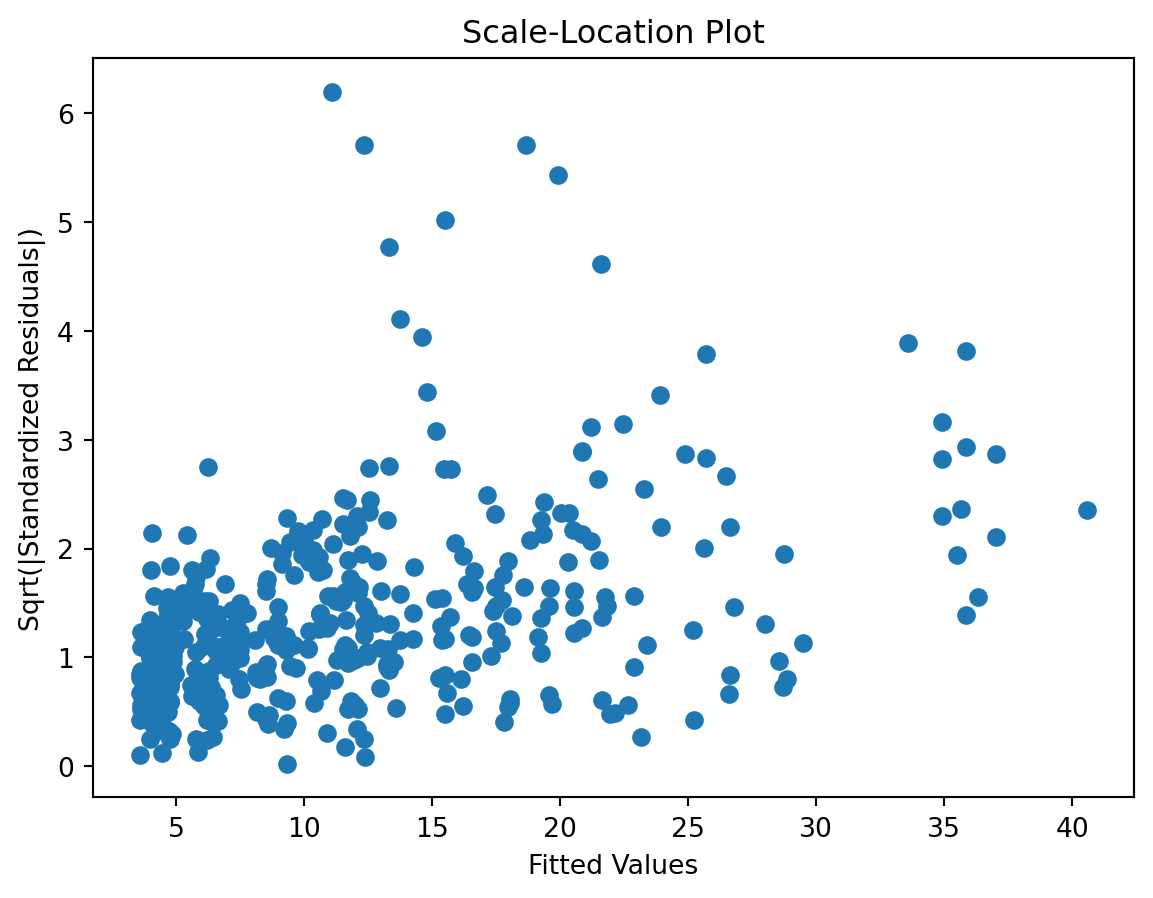
- heteroscedasticity?
- non-linearity?
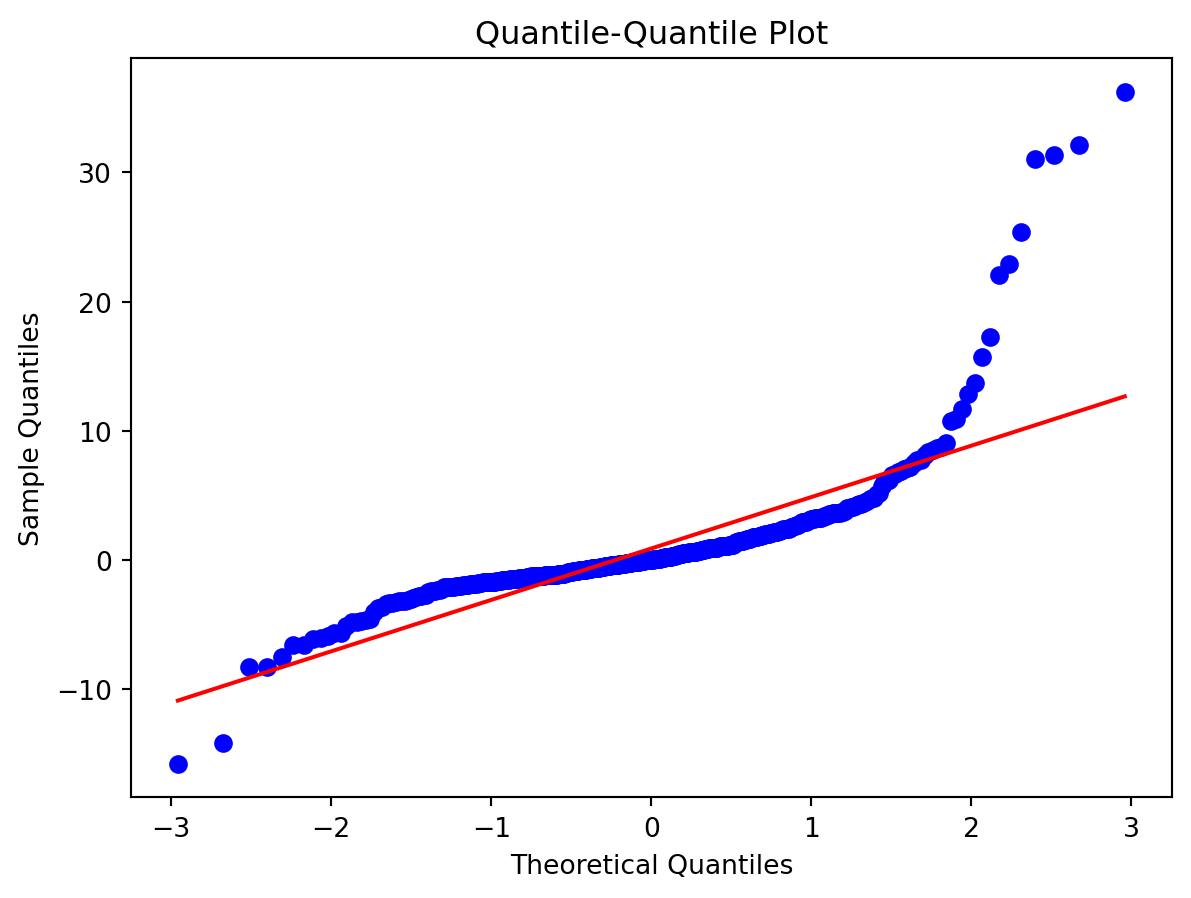
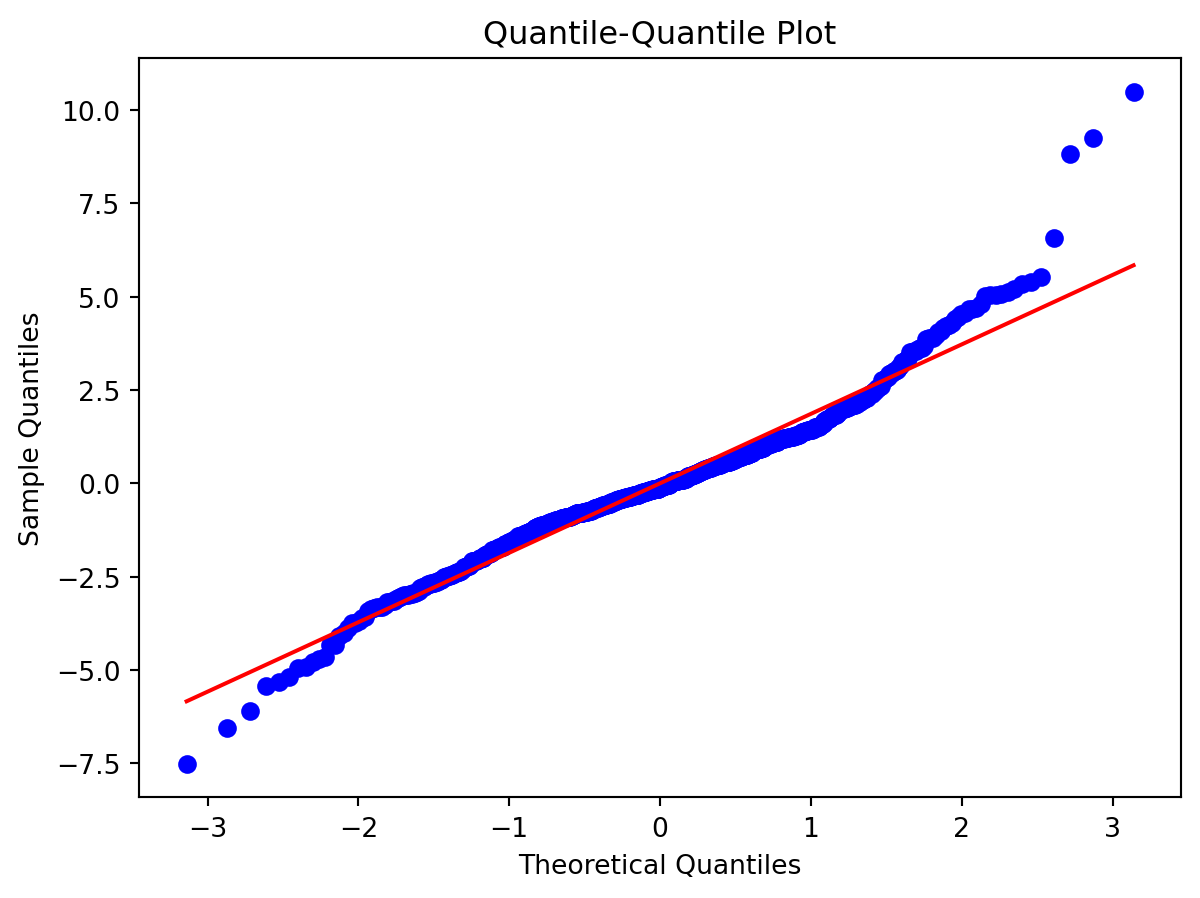
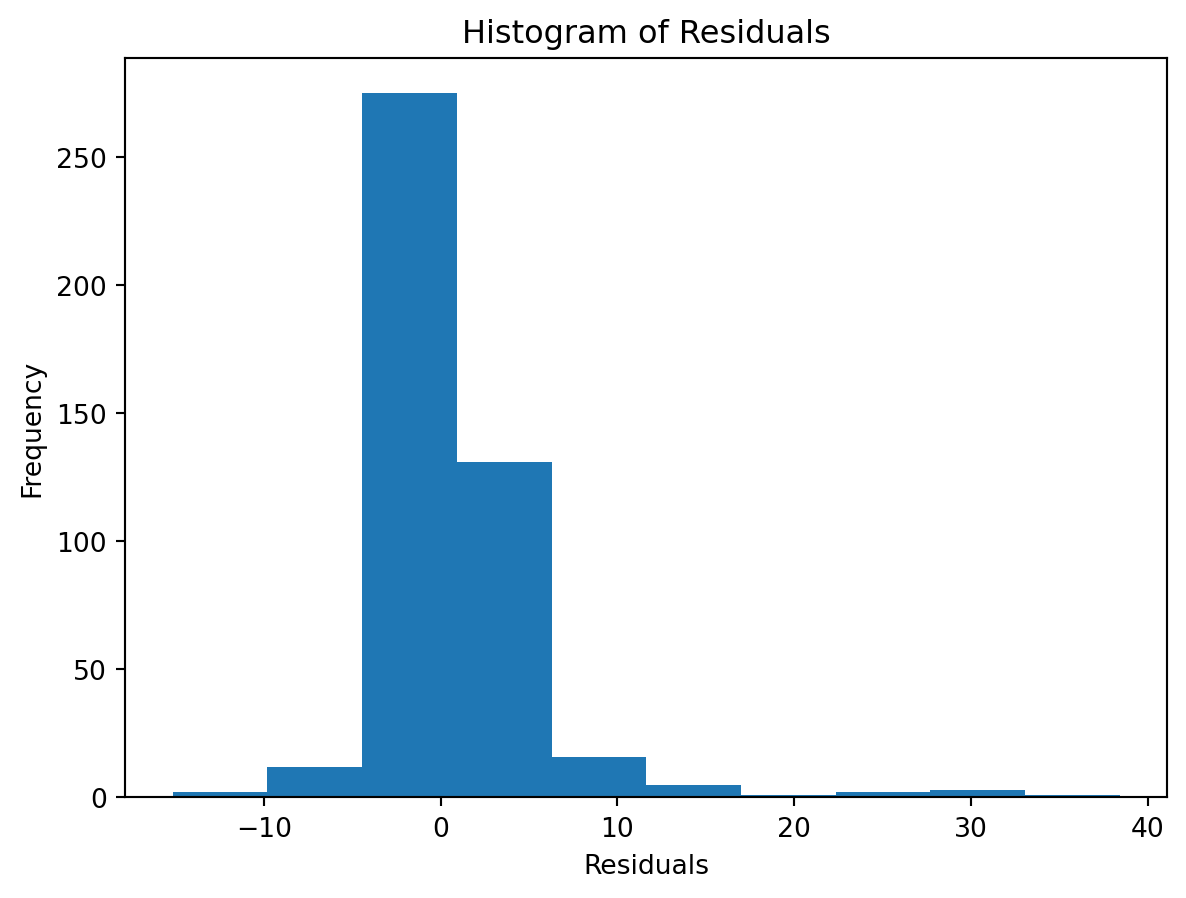
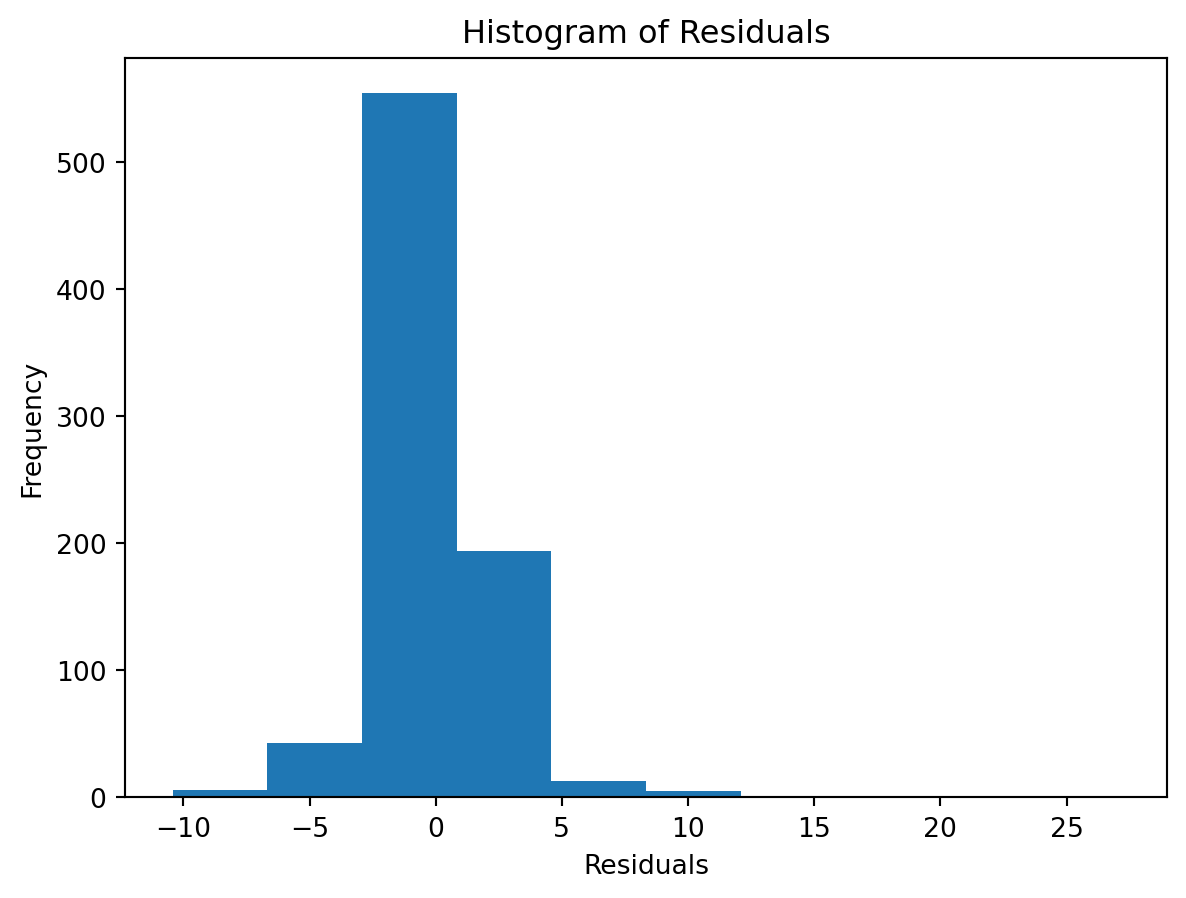
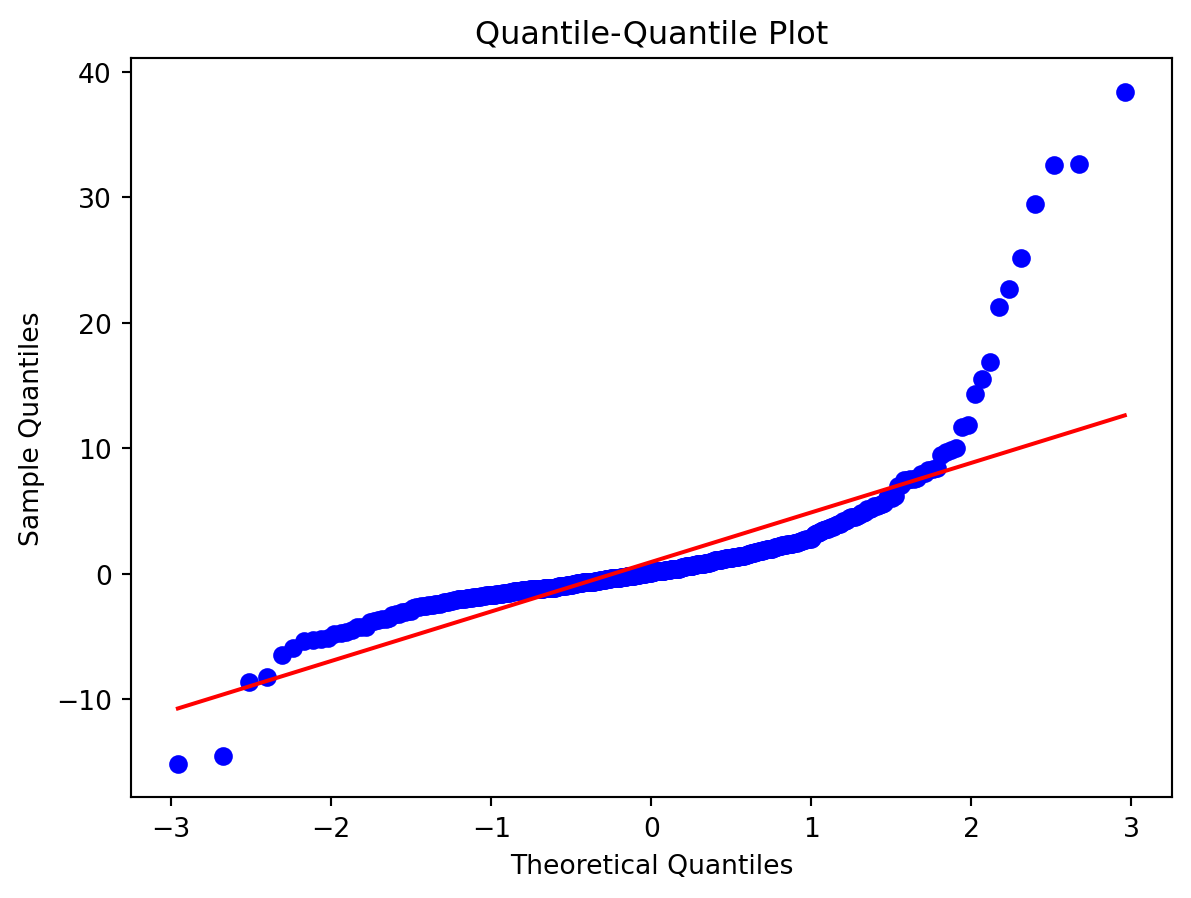
Normality of Residuals:
Check for …
- Are residuals normally distributed?
Leverage
Scale-Location plot
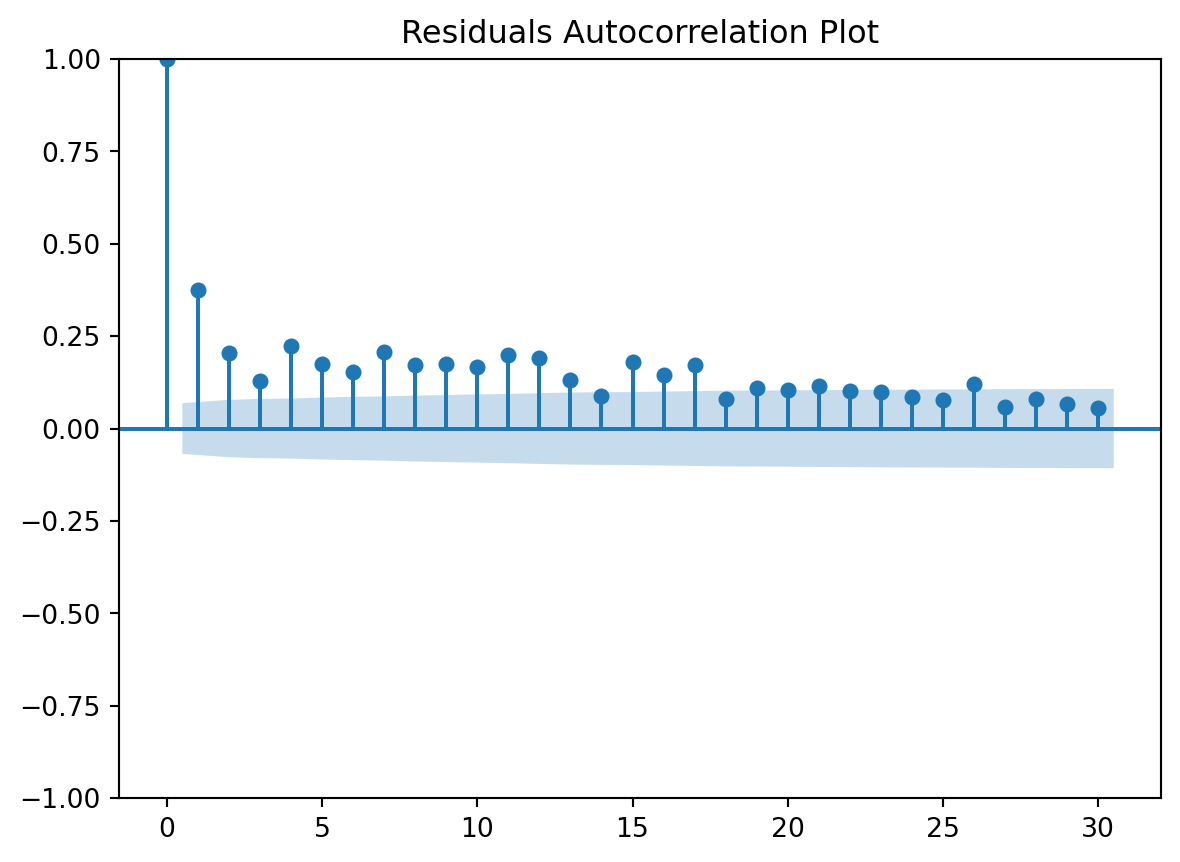
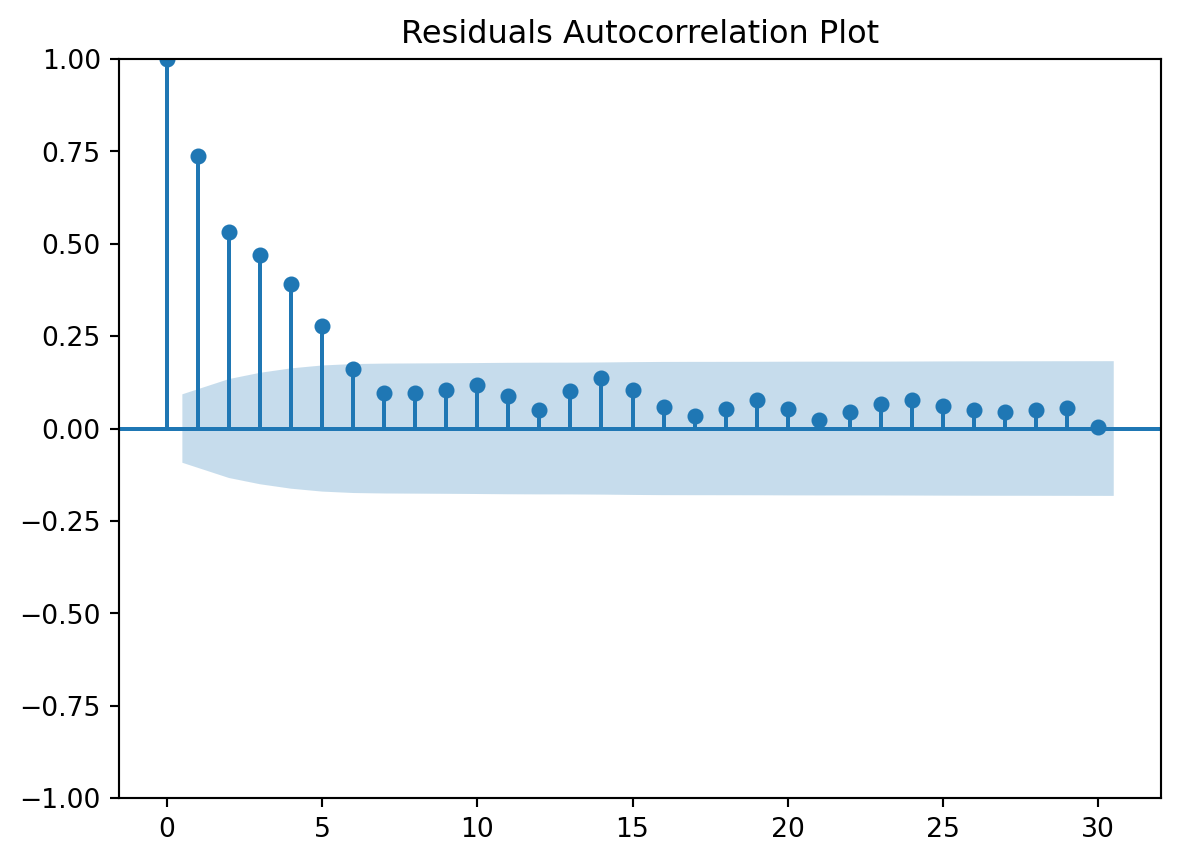
Residuals Autocorrelation Plot
Residuals vs Time
Again, overfits a lot.
Parameter: param_model__learning_rate
Parameter: param_model__max_depth
Parameter: param_model__min_samples_leaf
Parameter: param_model__min_samples_split
Parameter: param_model__n_estimators
Parameter: param_model__subsample
Parameter: param_vars__columns
Best model
{'model__learning_rate': 0.1,
'model__max_depth': 5,
'model__min_samples_leaf': 5,
'model__min_samples_split': 48,
'model__n_estimators': 60,
'model__subsample': 1,
'vars__columns': ['tt_tu_mean', 'td_mean']}⏩ stepit 'gb_tuned': Starting execution of `strom.modelling.assess_model()` 2026-04-12 13:38:27 ⏩ stepit 'get_single_split_metrics': Starting execution of `strom.modelling.get_single_split_metrics()` 2026-04-12 13:38:27 ✅ stepit 'get_single_split_metrics': Successfully completed and cached [exec time 0.0 seconds, cache time 0.0 seconds, size 1.0 KB] `strom.modelling.get_single_split_metrics()` 2026-04-12 13:38:27 ⏩ stepit 'cross_validate_pipe': Starting execution of `strom.modelling.cross_validate_pipe()` 2026-04-12 13:38:27 [Parallel(n_jobs=-1)]: Using backend LokyBackend with 4 concurrent workers. [Parallel(n_jobs=-1)]: Done 5 out of 5 | elapsed: 0.2s finished ✅ stepit 'cross_validate_pipe': Successfully completed and cached [exec time 0.2 seconds, cache time 0.0 seconds, size 2.2 KB] `strom.modelling.cross_validate_pipe()` 2026-04-12 13:38:27 ✅ stepit 'gb_tuned': Successfully completed and cached [exec time 0.3 seconds, cache time 0.0 seconds, size 151.9 KB] `strom.modelling.assess_model()` 2026-04-12 13:38:27
Metrics
| Single Split | CV | |||
|---|---|---|---|---|
| train | test | test | train | |
| MAE - Mean Absolute Error | 1.470662 | 2.647830 | 1.253754 | 1.600424 |
| MSE - Mean Squared Error | 5.422449 | 23.071686 | 2.896592 | 6.332113 |
| RMSE - Root Mean Squared Error | 2.328615 | 4.803300 | 1.574209 | 2.515238 |
| R2 - Coefficient of Determination | 0.941818 | 0.764277 | 0.541083 | 0.935997 |
| MAPE - Mean Absolute Percentage Error | 0.144154 | 0.211263 | 0.179474 | 0.138494 |
| EVS - Explained Variance Score | 0.941818 | 0.765142 | 0.570343 | 0.935997 |
| MeAE - Median Absolute Error | 0.978386 | 1.420108 | 1.075824 | 1.069829 |
| D2 - D2 Absolute Error Score | 0.787686 | 0.654864 | 0.307063 | 0.774522 |
| Pinball - Mean Pinball Loss | 0.735331 | 1.323915 | 0.626877 | 0.800212 |
Scatter plot matrix
Observed vs. Predicted and Residuals vs. Predicted
Check for …
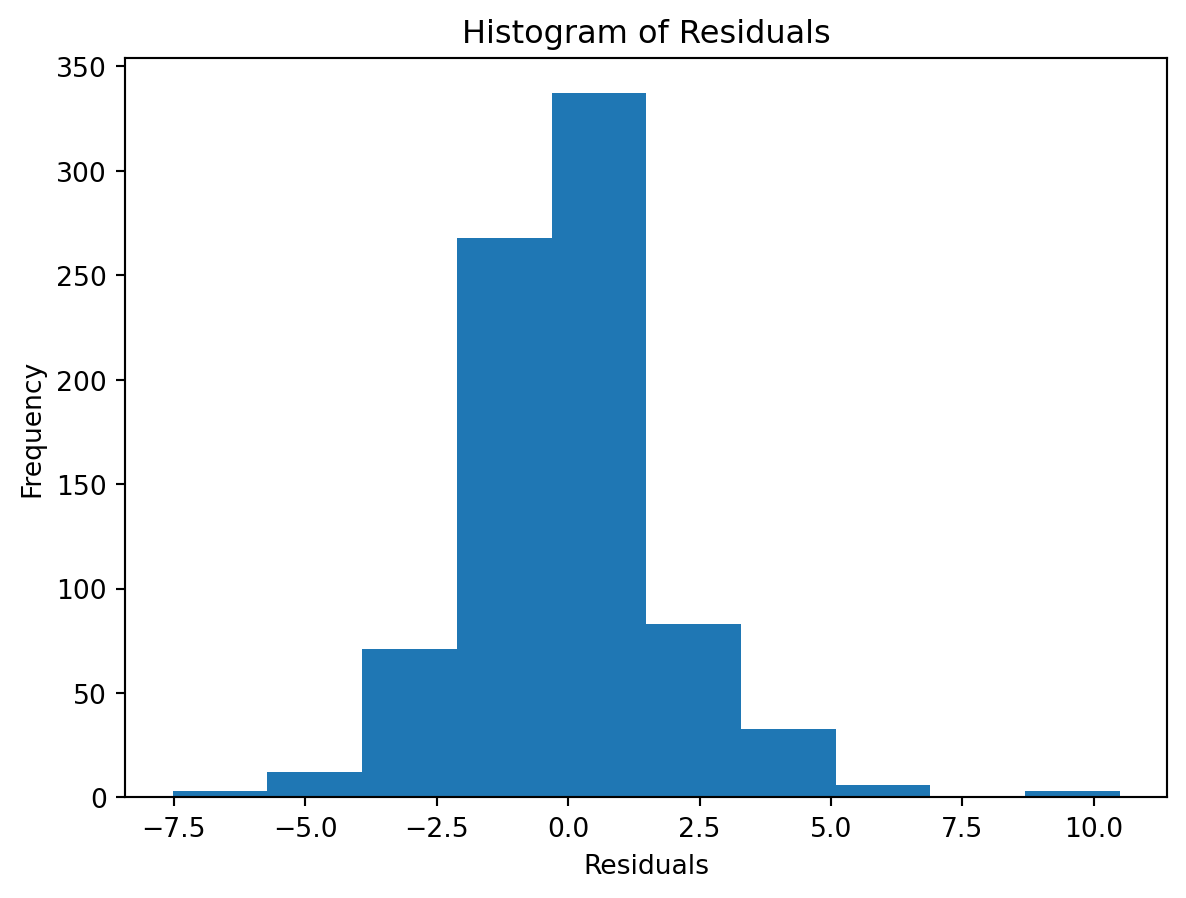
check the residuals to assess the goodness of fit.
- white noise or is there a pattern?
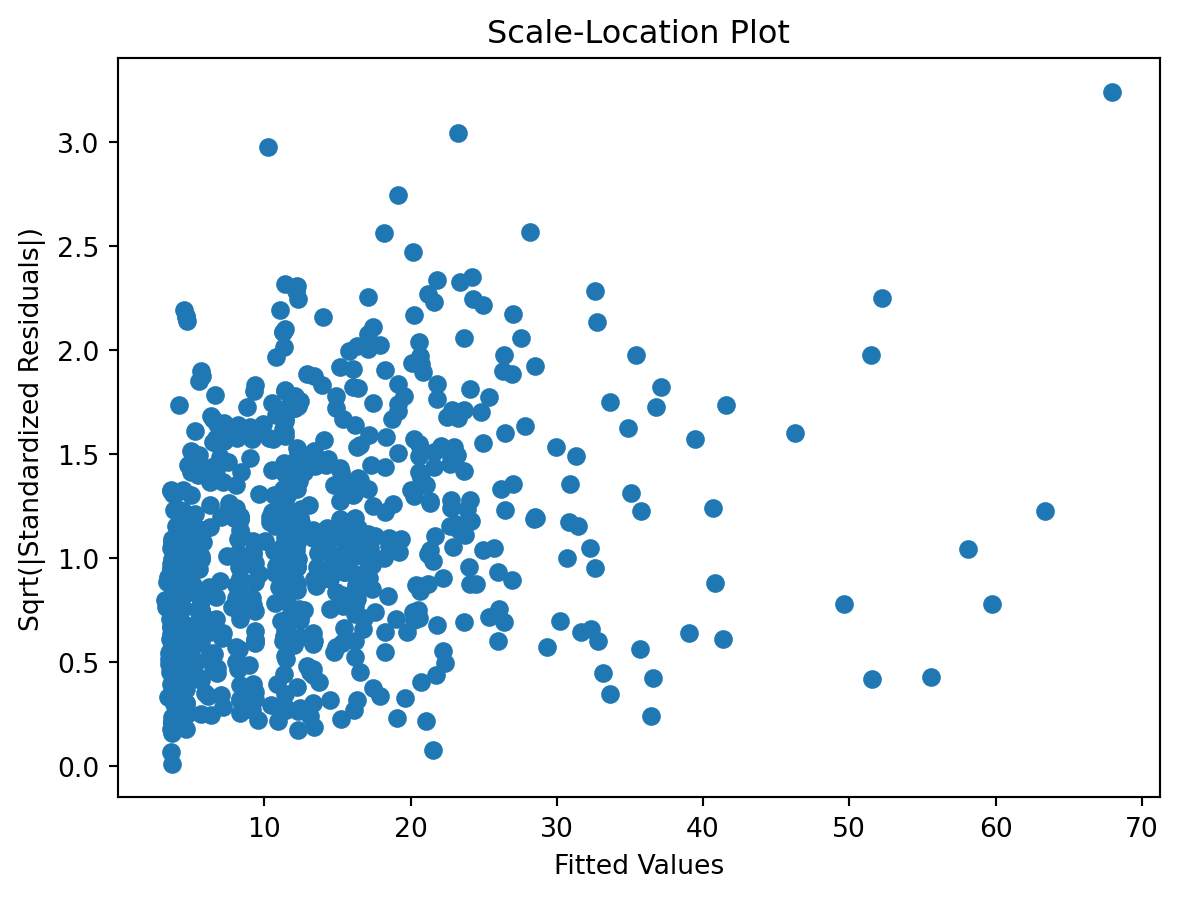
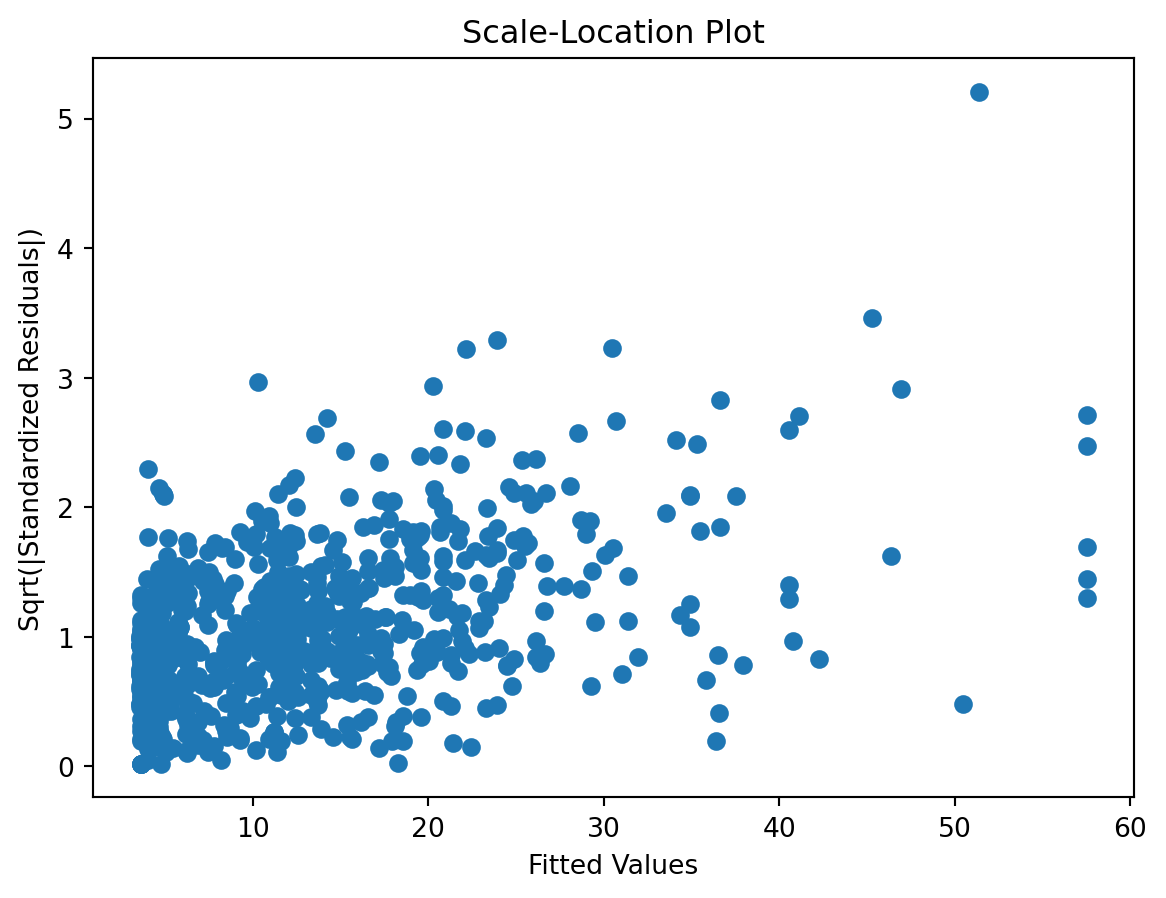
- heteroscedasticity?
- non-linearity?
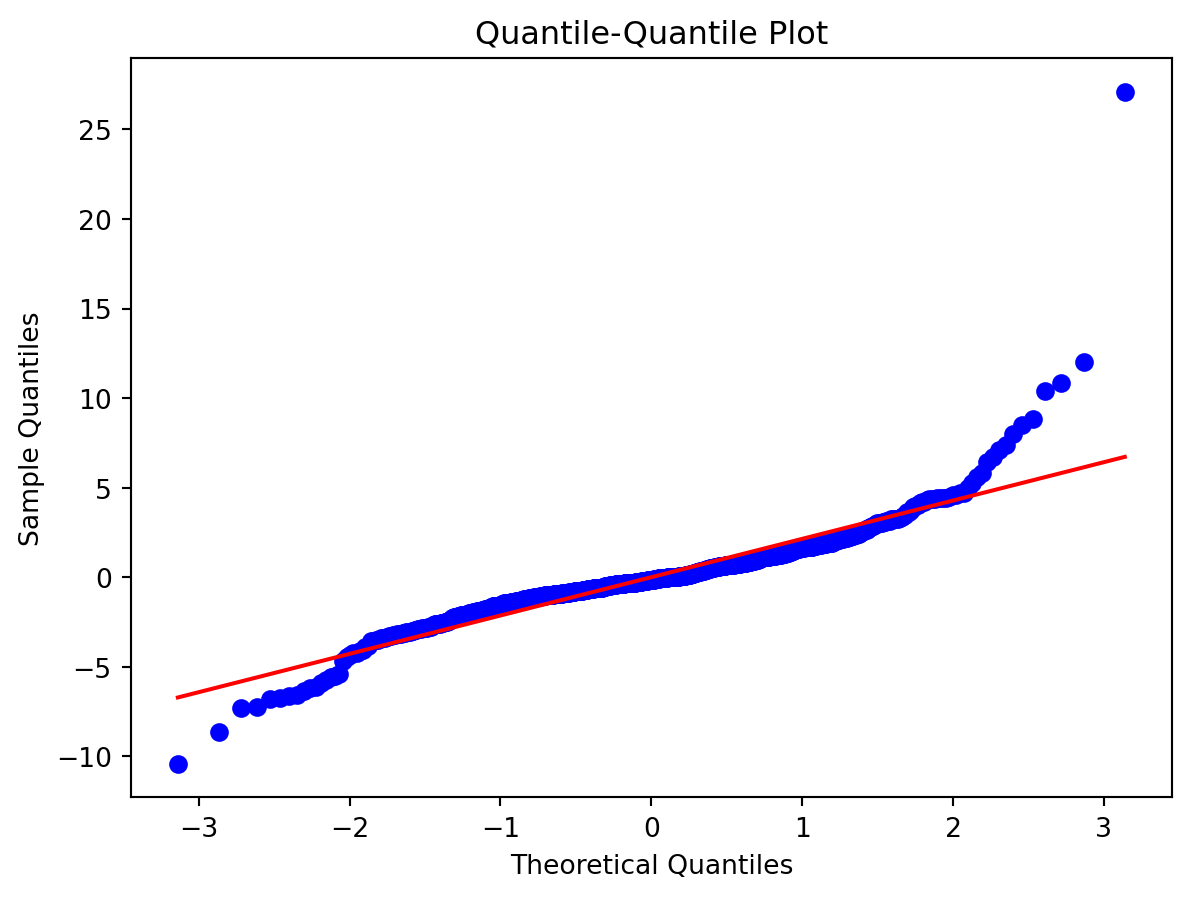
Normality of Residuals:
Check for …
- Are residuals normally distributed?
Leverage
Scale-Location plot
Residuals Autocorrelation Plot
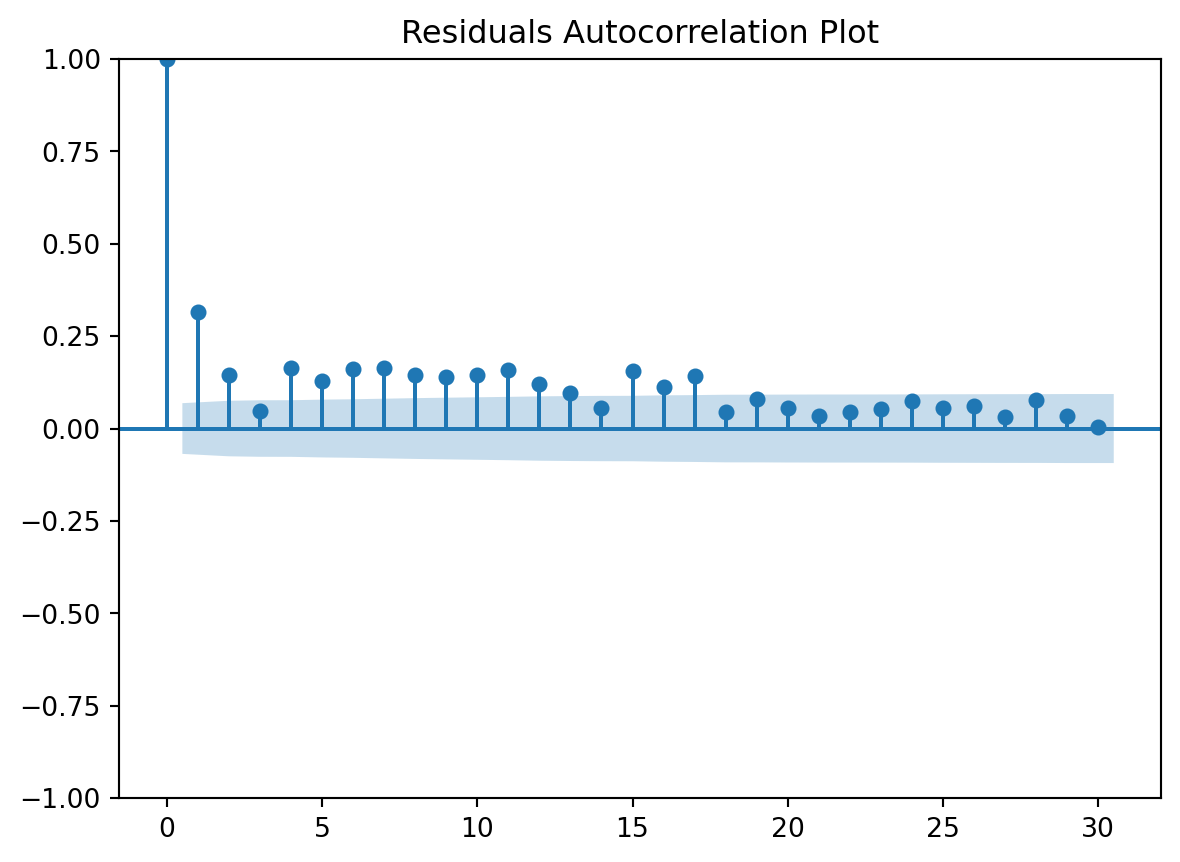
Residuals vs Time
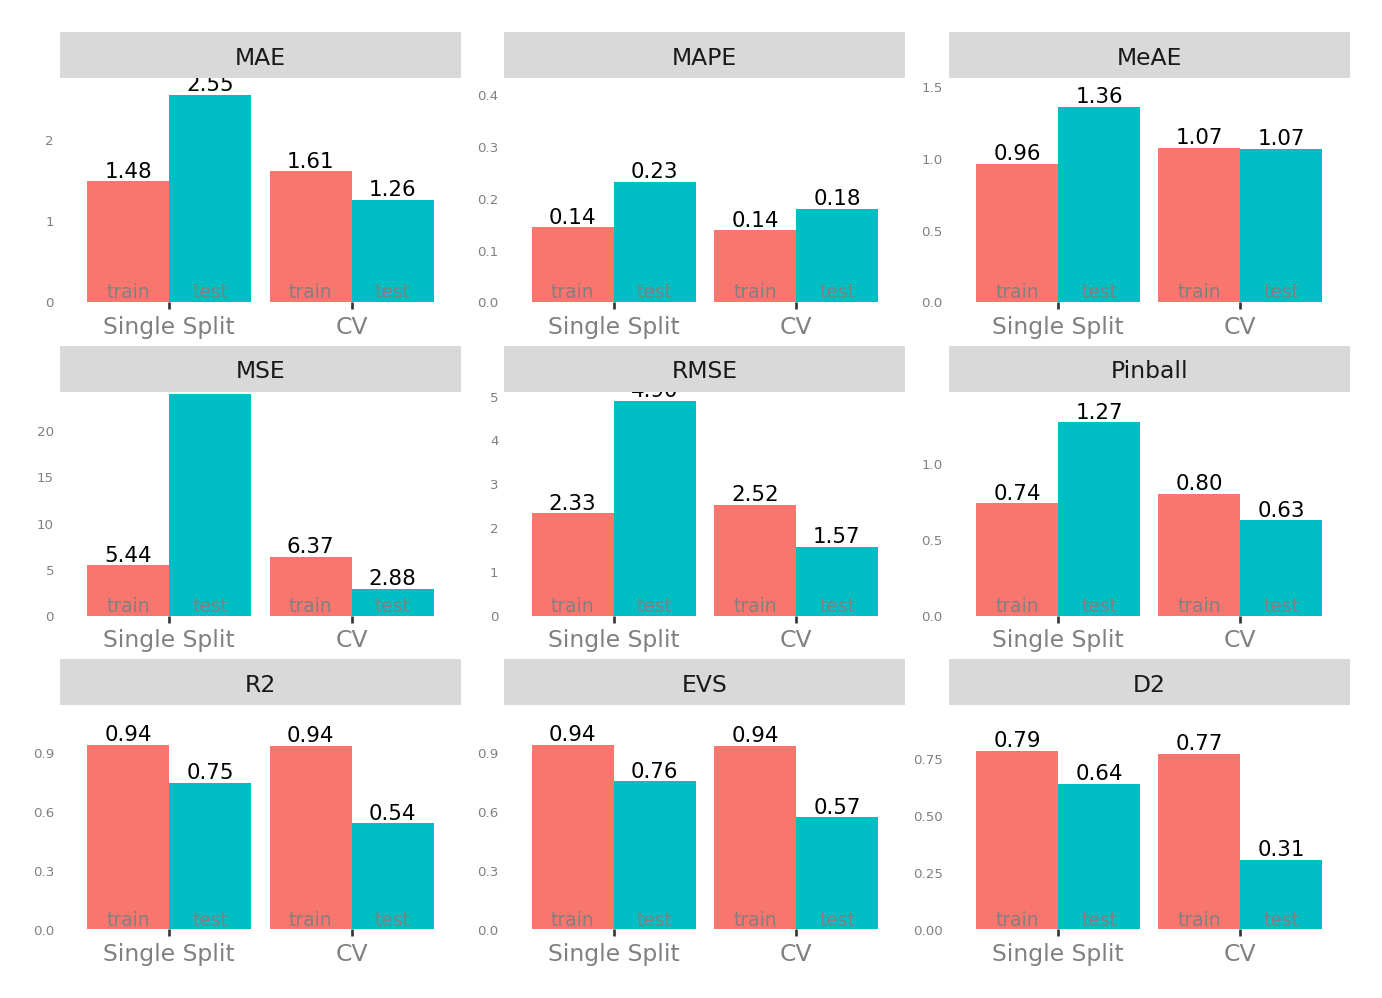
Compare vanilla vs. tuned
Cross-validation messages
♻️ stepit 'cross_validate_pipe': is up-to-date. Using cached result for `strom.modelling.cross_validate_pipe()` 2026-04-12 13:38:31 ♻️ stepit 'cross_validate_pipe': is up-to-date. Using cached result for `strom.modelling.cross_validate_pipe()` 2026-04-12 13:38:31
Metrics
Single split
Metrics based on the test set of the single split
Cross validation
Predictions, residuals, observed
next
Time vs. Predicted and Observed
Time vs. Residuals
Model details
Pipeline(steps=[('vars',
ColumnSelector(columns=['tt_tu_mean', 'rf_tu_mean', 'td_mean',
'vp_std_mean', 'tf_std_mean'])),
('model', GradientBoostingRegressor(random_state=7))])In a Jupyter environment, please rerun this cell to show the HTML representation or trust the notebook. On GitHub, the HTML representation is unable to render, please try loading this page with nbviewer.org.
Parameters
| steps | [('vars', ...), ('model', ...)] | |
| transform_input | None | |
| memory | None | |
| verbose | False |
Parameters
| columns | ['tt_tu_mean', 'rf_tu_mean', ...] |
Parameters
| loss | 'squared_error' | |
| learning_rate | 0.1 | |
| n_estimators | 100 | |
| subsample | 1.0 | |
| criterion | 'friedman_mse' | |
| min_samples_split | 2 | |
| min_samples_leaf | 1 | |
| min_weight_fraction_leaf | 0.0 | |
| max_depth | 3 | |
| min_impurity_decrease | 0.0 | |
| init | None | |
| random_state | 7 | |
| max_features | None | |
| alpha | 0.9 | |
| verbose | 0 | |
| max_leaf_nodes | None | |
| warm_start | False | |
| validation_fraction | 0.1 | |
| n_iter_no_change | None | |
| tol | 0.0001 | |
| ccp_alpha | 0.0 |
Pipeline(steps=[('vars', ColumnSelector(columns=['tt_tu_mean', 'td_mean'])),
('model',
GradientBoostingRegressor(max_depth=5, min_samples_leaf=5,
min_samples_split=48,
n_estimators=60, random_state=7,
subsample=1))])In a Jupyter environment, please rerun this cell to show the HTML representation or trust the notebook. On GitHub, the HTML representation is unable to render, please try loading this page with nbviewer.org.
Parameters
| steps | [('vars', ...), ('model', ...)] | |
| transform_input | None | |
| memory | None | |
| verbose | False |
Parameters
| columns | ['tt_tu_mean', 'td_mean'] |
Parameters
| loss | 'squared_error' | |
| learning_rate | 0.1 | |
| n_estimators | 60 | |
| subsample | 1 | |
| criterion | 'friedman_mse' | |
| min_samples_split | 48 | |
| min_samples_leaf | 5 | |
| min_weight_fraction_leaf | 0.0 | |
| max_depth | 5 | |
| min_impurity_decrease | 0.0 | |
| init | None | |
| random_state | 7 | |
| max_features | None | |
| alpha | 0.9 | |
| verbose | 0 | |
| max_leaf_nodes | None | |
| warm_start | False | |
| validation_fraction | 0.1 | |
| n_iter_no_change | None | |
| tol | 0.0001 | |
| ccp_alpha | 0.0 |