Outliers
Naive outliers
Z score
| date | nd | wd | nt | ht | obs | tt_tu_min | tt_tu_max | tt_tu_mean | tt_tu_median | ... | rs_ind_mean | rs_ind_median | rs_ind_std | wrtr_min | wrtr_max | wrtr_mean | wrtr_median | wrtr_std | _merge | wd_z | |
|---|---|---|---|---|---|---|---|---|---|---|---|---|---|---|---|---|---|---|---|---|---|
| 1652 | 2021-01-11 | 9.417486 | 50.273358 | 20.278434 | 29.994924 | 4.0 | -10.7 | -2.4 | -6.797917 | -6.80 | ... | 0.000000 | 0.0 | 0.000000 | NaN | NaN | NaN | NaN | NaN | both | 3.791542 |
| 1683 | 2021-02-11 | 8.757242 | 59.229410 | 21.809563 | 37.419846 | 4.0 | -12.4 | -4.5 | -8.064583 | -8.00 | ... | 0.229167 | 0.0 | 0.424744 | NaN | NaN | NaN | NaN | NaN | both | 4.707030 |
| 1684 | 2021-02-12 | 10.628064 | 64.885745 | 23.802731 | 41.083013 | 3.0 | -15.0 | -3.0 | -8.837500 | -8.50 | ... | 0.000000 | 0.0 | 0.000000 | NaN | NaN | NaN | NaN | NaN | both | 5.285221 |
| 1685 | 2021-02-13 | 12.663350 | 60.386570 | 58.274638 | 2.111932 | 3.0 | -13.4 | -2.9 | -8.031250 | -8.70 | ... | 0.000000 | 0.0 | 0.000000 | NaN | NaN | NaN | NaN | NaN | both | 4.825315 |
| 1686 | 2021-02-14 | 7.780126 | 51.373579 | 51.225951 | 0.147627 | 4.0 | -14.2 | 0.7 | -7.366667 | -7.65 | ... | 0.000000 | 0.0 | 0.000000 | NaN | NaN | NaN | NaN | NaN | both | 3.904007 |
| 2352 | 2022-12-12 | 10.483619 | 55.413417 | 23.588144 | 31.825273 | 0.0 | -12.2 | -0.2 | -6.552083 | -6.45 | ... | 0.000000 | 0.0 | 0.000000 | NaN | NaN | NaN | NaN | NaN | both | 4.316959 |
| 2353 | 2022-12-13 | 10.483619 | 55.413417 | 23.588144 | 31.825273 | 0.0 | -15.1 | -4.1 | -8.937500 | -8.80 | ... | 0.000000 | 0.0 | 0.000000 | NaN | NaN | NaN | NaN | NaN | both | 4.316959 |
| 2357 | 2022-12-17 | 9.735464 | 44.638392 | 40.771966 | 3.866426 | 1.0 | -7.1 | -1.3 | -3.133333 | -2.70 | ... | 0.083333 | 0.0 | 0.279310 | NaN | NaN | NaN | NaN | NaN | both | 3.215536 |
| 2358 | 2022-12-18 | 9.571665 | 57.284575 | 56.603989 | 0.680586 | 1.0 | -8.2 | -0.6 | -4.979167 | -5.35 | ... | 0.000000 | 0.0 | 0.000000 | NaN | NaN | NaN | NaN | NaN | both | 4.508229 |
| 2753 | 2024-01-17 | 8.292732 | 78.417918 | 26.954256 | 51.463661 | 2.0 | -7.7 | 3.7 | -1.081250 | -0.30 | ... | 0.208333 | 0.0 | 0.410414 | NaN | NaN | NaN | NaN | NaN | both | 6.668480 |
| 2756 | 2024-01-20 | 8.135196 | 43.711800 | 42.183642 | 1.528158 | 3.0 | -11.0 | -0.2 | -6.272917 | -7.20 | ... | 0.000000 | 0.0 | 0.000000 | NaN | NaN | NaN | NaN | NaN | both | 3.120819 |
| 3097 | 2024-12-26 | 9.066678 | 44.945877 | 44.945877 | 0.000000 | 6.0 | -7.9 | -0.5 | -4.900000 | -5.05 | ... | 0.000000 | 0.0 | 0.000000 | NaN | NaN | NaN | NaN | NaN | both | 3.246967 |
| 3101 | 2024-12-30 | 7.051453 | 45.254548 | 16.116617 | 29.137931 | 4.0 | -7.1 | -0.2 | -4.233333 | -4.95 | ... | 0.000000 | 0.0 | 0.000000 | NaN | NaN | NaN | NaN | NaN | both | 3.278519 |
| 3106 | 2025-01-04 | 5.901932 | 46.101217 | 45.221710 | 0.879507 | 1.0 | -8.6 | -2.2 | -5.245833 | -4.65 | ... | 0.000000 | 0.0 | 0.000000 | NaN | NaN | NaN | NaN | NaN | both | 3.365066 |
| 3116 | 2025-01-14 | 8.003776 | 42.882370 | 16.230903 | 26.651467 | 3.0 | -8.8 | -0.1 | -4.795833 | -5.35 | ... | 0.000000 | 0.0 | 0.000000 | NaN | NaN | NaN | NaN | NaN | both | 3.036035 |
| 3121 | 2025-01-19 | 11.450753 | 42.848456 | 42.848456 | 0.000000 | 2.0 | -5.1 | 7.2 | -0.562500 | -0.45 | ... | 0.000000 | 0.0 | 0.000000 | NaN | NaN | NaN | NaN | NaN | both | 3.032568 |
| 3413 | 2025-11-07 | 10.197346 | 51.279778 | 31.877629 | 19.402149 | 4.0 | -1.0 | 8.4 | 2.258333 | 1.50 | ... | 0.000000 | 0.0 | 0.000000 | NaN | NaN | NaN | NaN | NaN | both | 3.894418 |
| 3414 | 2025-11-08 | 10.756137 | 49.385863 | 48.623568 | 0.762295 | 7.0 | -1.6 | 5.9 | 2.708696 | 4.20 | ... | 0.000000 | 0.0 | 0.000000 | NaN | NaN | NaN | NaN | NaN | both | 3.700822 |
| 3415 | 2025-11-09 | 11.124231 | 44.922692 | 44.922692 | 0.000000 | 3.0 | 4.2 | 8.4 | 5.987500 | 6.00 | ... | 0.500000 | 0.5 | 0.510754 | NaN | NaN | NaN | NaN | NaN | both | 3.244597 |
| 3416 | 2025-11-10 | 11.322472 | 49.466037 | 12.111094 | 37.354943 | 4.0 | 2.0 | 10.2 | 6.070833 | 5.95 | ... | 0.250000 | 0.0 | 0.442326 | NaN | NaN | NaN | NaN | NaN | both | 3.709018 |
| 3473 | 2026-01-06 | 16.434401 | 49.898363 | 38.799580 | 11.098783 | 2.0 | -14.1 | -7.0 | -10.700000 | -10.40 | ... | 0.000000 | 0.0 | 0.000000 | NaN | NaN | NaN | NaN | NaN | both | 3.753210 |
| 3474 | 2026-01-07 | 12.201027 | 48.493904 | 19.939128 | 28.554775 | 2.0 | -13.4 | -5.3 | -9.758333 | -10.40 | ... | 0.000000 | 0.0 | 0.000000 | NaN | NaN | NaN | NaN | NaN | both | 3.609646 |
22 rows × 73 columns
Z score
| date | nd | wd | nt | ht | obs | tt_tu_min | tt_tu_max | tt_tu_mean | tt_tu_median | ... | rs_ind_median | rs_ind_std | wrtr_min | wrtr_max | wrtr_mean | wrtr_median | wrtr_std | _merge | wd_z | wd_zr | |
|---|---|---|---|---|---|---|---|---|---|---|---|---|---|---|---|---|---|---|---|---|---|
| 1683 | 2021-02-11 | 8.757242 | 59.229410 | 21.809563 | 37.419846 | 4.0 | -12.4 | -4.5 | -8.064583 | -8.00 | ... | 0.0 | 0.424744 | NaN | NaN | NaN | NaN | NaN | both | 4.707030 | 7.659755 |
| 1684 | 2021-02-12 | 10.628064 | 64.885745 | 23.802731 | 41.083013 | 3.0 | -15.0 | -3.0 | -8.837500 | -8.50 | ... | 0.0 | 0.000000 | NaN | NaN | NaN | NaN | NaN | both | 5.285221 | 8.560865 |
| 1685 | 2021-02-13 | 12.663350 | 60.386570 | 58.274638 | 2.111932 | 3.0 | -13.4 | -2.9 | -8.031250 | -8.70 | ... | 0.0 | 0.000000 | NaN | NaN | NaN | NaN | NaN | both | 4.825315 | 7.844102 |
| 2352 | 2022-12-12 | 10.483619 | 55.413417 | 23.588144 | 31.825273 | 0.0 | -12.2 | -0.2 | -6.552083 | -6.45 | ... | 0.0 | 0.000000 | NaN | NaN | NaN | NaN | NaN | both | 4.316959 | 7.051829 |
| 2353 | 2022-12-13 | 10.483619 | 55.413417 | 23.588144 | 31.825273 | 0.0 | -15.1 | -4.1 | -8.937500 | -8.80 | ... | 0.0 | 0.000000 | NaN | NaN | NaN | NaN | NaN | both | 4.316959 | 7.051829 |
| 2358 | 2022-12-18 | 9.571665 | 57.284575 | 56.603989 | 0.680586 | 1.0 | -8.2 | -0.6 | -4.979167 | -5.35 | ... | 0.0 | 0.000000 | NaN | NaN | NaN | NaN | NaN | both | 4.508229 | 7.349923 |
| 2753 | 2024-01-17 | 8.292732 | 78.417918 | 26.954256 | 51.463661 | 2.0 | -7.7 | 3.7 | -1.081250 | -0.30 | ... | 0.0 | 0.410414 | NaN | NaN | NaN | NaN | NaN | both | 6.668480 | 10.716675 |
7 rows × 74 columns
This is of course naive and catches many allegedly legit observations.
STL-based outlier detection
For Wärmestrom is particularly relevant to consider the season in detecting outliers. So let’s try that, using Multiple Seasonal-Trend decomposition using Loess.
MSTL
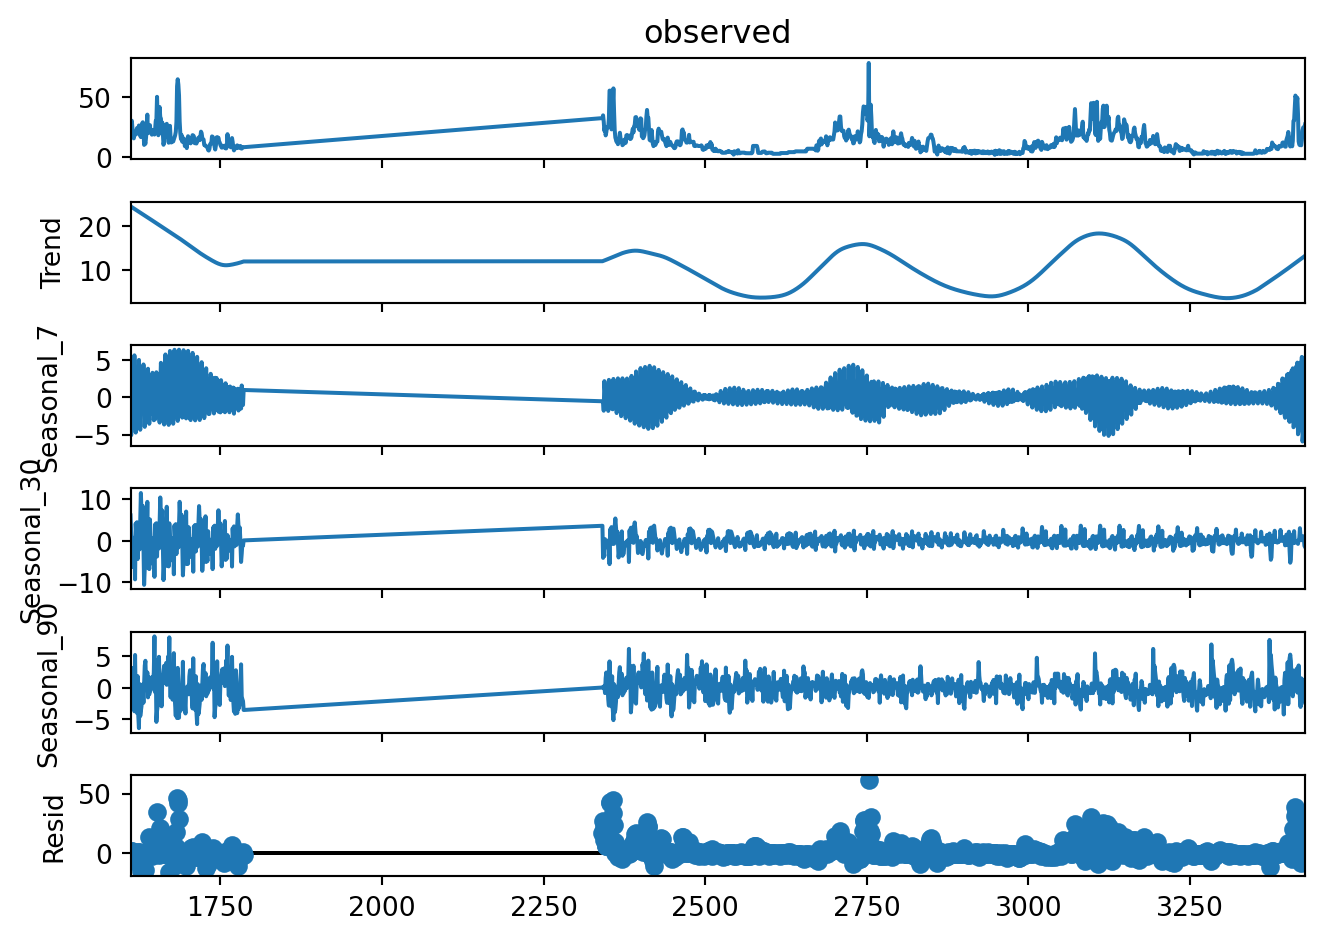
This seems better. It catches some observations that, looking only at the univariate distribution, may not seem like an outlier, but within the typical consumption in the season, the seem extreme.
I’ve spotted a couple of those points already in the correlation matrix. So let’s see how do these outliers look out there.
Well, a bit better than the naive approach, but still fails to detect a couple of points that, for higher temperatures show a very high consumption. Perhaps we need to resort to multivariate outlier detection.
Prophet-based outlier detection
/home/runner/work/strom/strom/.venv/lib/python3.10/site-packages/plotly/io/_json.py:558: UserWarning:

Discarding nonzero nanoseconds in conversion.
Well, rather similar. I mean, the band is pretty wide, and not sensible to the seasons. So, unsurprisingly, it only catches extreme values on the cold season. Again, it seems we would need necesarilly to include the climate data.
Isolation forests
Well, it catches again the extreme values, and a couple of very low values. But still fails to capture the possible outliers in the warm season.
Local Outlier Factor - LOF
I had higher hopes about this one. But yeah, it is pretty sensitive to the parameters.